

Linear Regression Statistics
March 11, 2024, 10:28 AM
Indicators
0 Comments
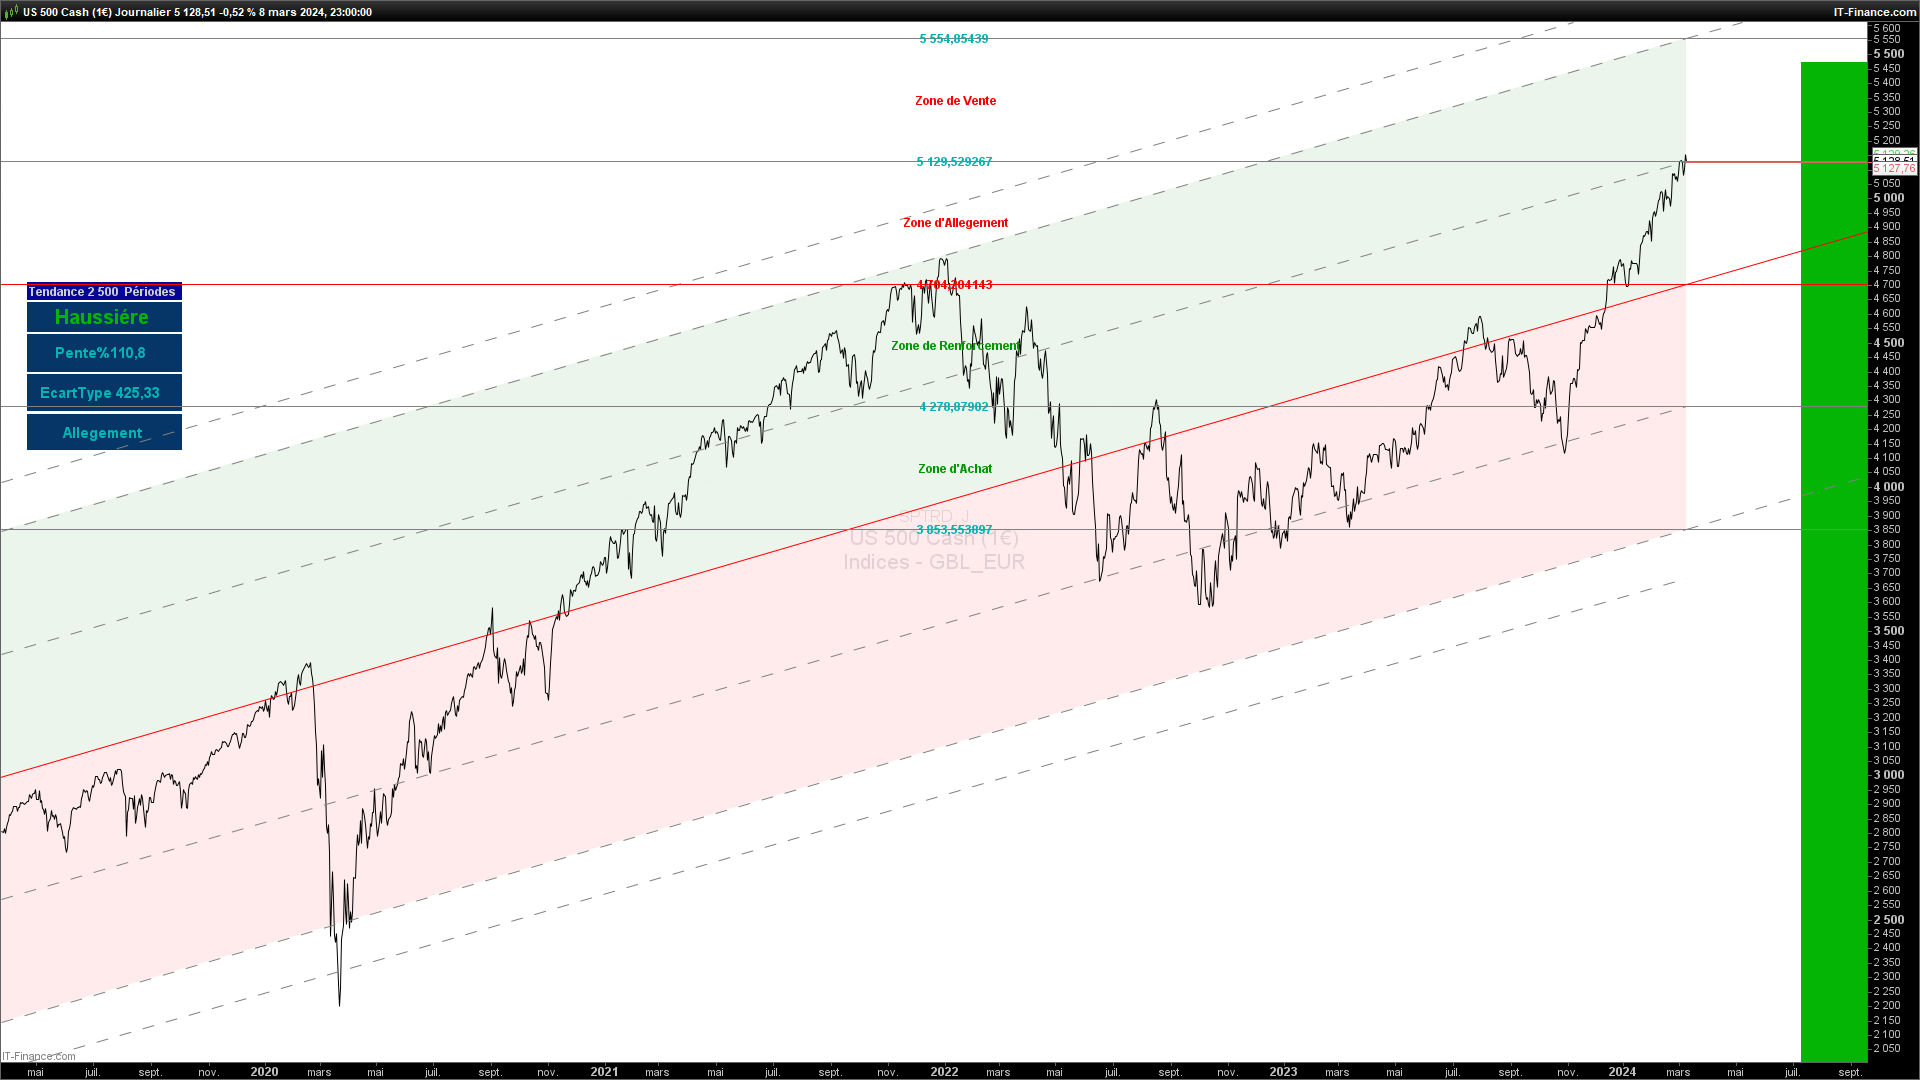
Regression channel: this ProRealTime script is designed to generate a linear regression channel and perform several analytical determinations based on this regression.
Here’s a complete analysis and explanation of the code:
- **Parameter definition** : The script begins by defining the parameters of the regression channel, such as channel type, deviation multiplier and drawing colors.
- **Regression calculations**: it uses a “for” loop to calculate the sums of price (`sumy`), time (`sumx`) and their respective products and squares needed to compute the slope (`b` ) and y-intercept (`a`) of the linear regression line.
- **Draw the regression line**: Once “a” and “b” have been determined, a segment is drawn to represent the regression line.
- **Calculate channel width** : The channel width is determined by the standard deviation or standard error multiplied by a deviation factor “NbDeviation”.
- **Draw channel**: The script draws the upper and lower limits of the channel, as well as the median line. Green triangles suggest bullish zones and red bearish zones, indicating buy and sell zones.
defparam drawonlastbaronly=true
if islastbarupdate then
// --- settings
//lookback= max(1,barindex) //channel period
lookback = 200
ChannelType = 1 //1= Standard Deviation ; 2= Standard Erro
NbDeviation = NbD //Deviation multiplier
colorRed = 255
colorGreen = 255
colorBlue = 0
// --- end of settings

sumx = 0
sumy = 0
sumxy = 0
sumx2 = 0

for cmpt = lookback downto 0 do

tmpx = cmpt
tmpy = close[cmpt]
sumy = sumy+tmpy
sumx = sumx+tmpx
sumx2 = sumx2 + (tmpx*tmpx)
sumxy = sumxy + (tmpy*tmpx)
next

n = lookback+1

if (sumx2 = sumx * sumx) then // protection to avoid infinite values
b = sumxy - sumx * sumy
else
b = (n * sumxy - sumx * sumy) / (n * sumx2 - sumx * sumx)
endif
a = (sumy - b * sumx) / n
yy=a
drawsegment(barindex[lookback],a+b*lookback,barindex,a+b) coloured("red")

//channel
if ChannelType = 1 then //Standard Deviation
dat = std[lookback]*NbDeviation
dat2=dat*1.2
else
dat = std[lookback]*NbDeviation
dat2=dat*1.2
endif

compt=0
hauteur=(a+b*lookback)+(a+b)
coordX=barindex+lookback
dist= (abs((a+b)-hauteur)-(a+b))
Coordx1=barindex[Lookback]
coordY=(a+b+dat)-dist
coordY1=(a+b)-dist
coordY2=(a+b-dat)-dist
m = round(((coordy1-(a+b))*100) / lookback,2)
Pente = m//round(((a-(a[lookback]))) / lookback,2) barindex,a+b,coordX ,coordy1)
ANGLE = round(ATAN(pente))
ec=round(((a+b)+dat/2)-(a+b),2)
DRAWTRIANGLE(barindex[lookback],(a+b*lookback)+dat, barindex,a+b*0+dat,barindex,a+b*0) coloured("green",alpha/12) BORDERCOLOR("green",1)
DRAWTRIANGLE(barindex[lookback],(a+b*lookback)+dat, barindex[lookback],a+b*lookback,barindex,a+b*0)coloured("green",alpha/12) BORDERCOLOR("green",1)

DRAWTRIANGLE(barindex[lookback],(a+b*lookback)-dat, barindex,a+b*0-dat,barindex,a+b*0) coloured("red",alpha/12) BORDERCOLOR("red",1)
DRAWTRIANGLE(barindex[lookback],(a+b*lookback)-dat, barindex[lookback],a+b*lookback,barindex,a+b*0)coloured("red",alpha/12) BORDERCOLOR("red",1)

drawsegment(barindex[lookback],(a+b*lookback)+dat/2,barindex,a+b*0+dat/2) coloured("gray") style(dottedline2)
drawsegment(barindex[lookback],(a+b*lookback)+dat,barindex,a+b*0+dat) coloured("gray") style(dottedline2)
drawsegment(barindex[lookback],(a+b*lookback)-dat/2,barindex,a+b*0-dat/2) coloured("gray") style(dottedline2)
drawsegment(barindex[lookback],(a+b*lookback)-dat,barindex,a+b*0-dat) coloured("gray") style(dottedline2)
drawsegment(barindex[lookback],(a+b*lookback)+dat2,barindex,a+b*0+dat2) coloured("gray") style(dottedline2)
drawsegment(barindex[lookback],(a+b*lookback)-dat2,barindex,a+b*0-dat2) coloured("gray") style(dottedline2)
//drawsegment(barindex,a+b*0+dat,coordX,a+b*0+dat) coloured("gray") style(dottedline2)
//drawsegment(barindex[lookback],(a+b*lookback)-dat,barindex,a+b*0-dat) coloured("gray") style(dottedline2)
if futur=1 then
a1=a+b+dat
a2=a+b+dat/2
a3=a+b-dat
a4=a+b-dat/2
a5=a+b
b1=a1+(a1-a2)*0.5
b2=a1-(a1-a2)*0.5
b3=a5-(a5-a4)*0.5
b4=a2-(a2-a5)*0.5
b5=a4-(a4-a3)*0.5
drawsegment(barindex,a+b+dat,coordX ,coordy) coloured("gray") style(dottedline2)
drawsegment(barindex,a+b,coordX ,coordy1)coloured("red")
drawsegment(barindex,a+b-dat,coordX ,coordy2) coloured("gray") style(dottedline2)
drawsegment(Coordx1 ,a+b+dat,coordX ,a+b+dat) coloured("gray") style(line,1)
drawsegment(Coordx1,a+b+dat/2,coordX ,a+b+dat/2) coloured("gray") style(line,1)
drawsegment(Coordx1 ,a+b+dat,coordX ,a+b+dat) coloured("gray") style(line,1)
drawsegment(Coordx1,a+b,coordX ,a+b) coloured("red") style(line,1)
drawsegment(Coordx1,a+b-dat/2,coordX ,a+b-dat/2) coloured("gray") style(line,1)
drawsegment(Coordx1 ,a+b-dat,coordX ,a+b-dat) coloured("gray") style(line,1)
DRAWTEXT ("Zone de Forte Vente",10+y1,b1,Dialog,Bold,12) anchor(MIDDLE ,xshift,value)coloured(250,0,00,255)
DRAWTEXT ("Zone de Vente",10+y1,b2,Dialog,Bold,12) anchor(MIDDLE ,xshift,value)coloured(250,0,0,255)
DRAWTEXT ("Zone d'Allegement",10+y1,b4,Dialog,Bold,12) anchor(MIDDLE ,xshift,value)coloured(250,0,0,255)
DRAWTEXT ("Zone de Renforcement",10+y1,b3,Dialog,Bold,12) anchor(MIDDLE ,xshift,value)coloured(0,150,0,255)
DRAWTEXT ("Zone d'Achat",10+y1,b5,Dialog,Bold,12) anchor(MIDDLE ,xshift,value)coloured(0,150,0,255)
DRAWTEXT ("#a1#",10+y1,a1,Dialog,Bold,12) anchor(MIDDLE ,xshift,value)coloured(0,180,180,255)
DRAWTEXT ("#a2#",10+y1,a2,Dialog,Bold,12) anchor(MIDDLE ,xshift,value)coloured(0,180,180,255)
DRAWTEXT ("#a3#",10+y1,a3,Dialog,Bold,12) anchor(MIDDLE ,xshift,value)coloured(0,180,180,255)
DRAWTEXT ("#a4#",10+y1,a4,Dialog,Bold,12) anchor(MIDDLE ,xshift,value)coloured(0,180,180,255)
DRAWTEXT ("#a5#",10+y1,a5,Dialog,Bold,12) anchor(MIDDLE ,xshift,value)coloured(250,0,0,255)
endif
endif
Ra=M>=-1 and M<=1

drawrectangle(25+X,112+Y,180+X,130+Y)anchor(bottomleft)coloured(0,0,150,alpha)bordercolor(0,50,100,0)
drawrectangle(25+X,80+Y,180+X,110+Y)anchor(bottomleft)coloured(0,50,100,alpha)bordercolor(0,50,100,0)

DRAWTEXT("Tendance #lookback# Périodes",100+X,121+Y,Dialog,Bold,12)anchor(bottomleft) coloured(210,210,210,alpha)
if M>1 then

drawrectangle(1800-X1,1000,2000-X1,0)anchor(bottomleft)coloured(0,180,0,alpha)bordercolor(0,50,100,0)
DRAWTEXT("Haussiére",100+X,95+Y,Dialog,Bold,20)anchor(bottomleft) coloured(0,180,0,255)
endif
if m<-1 then

drawrectangle(1800-X1,1000,2000-X1,0)anchor(bottomleft)coloured(250,0,0,alpha)bordercolor(0,50,100,0)
DRAWTEXT("Baissiére",100+X,95+Y,Dialog,Bold,20)anchor(bottomleft) coloured(250,0,0,255)
endif
if ra then

drawrectangle (1800-X1,1000,2000-X1,0)anchor(bottomleft)coloured (180,180,180,alpha)bordercolor (0,50,100,0)
DRAWTEXT ("Range",100+X,95+Y,Dialog,Bold,20)anchor(bottomleft ) coloured(0,180,180,255)
endif
drawrectangle(25+X,40+Y,180+X,78+Y)anchor(bottomleft)coloured(0,50,100,alpha)bordercolor(0,50,100,0)
DRAWTEXT ("Pente%#Pente#",100+X,60+Y,Dialog,Bold,15)anchor(bottomleft ) coloured(0,180,180,255)

drawrectangle(25+X,1+Y,180+X,38+Y)anchor(bottomleft)coloured(0,50,100,alpha)bordercolor(0,50,100,0)
DRAWTEXT ("EcartType #ec#",100+X,20+Y,Dialog,Bold,15)anchor(bottomleft ) coloured(0,180,180,255)
drawrectangle(25+X,Y-38,180+X,Y-2)anchor(bottomleft)coloured(0,50,100,alpha)bordercolor(0,50,100,0)
if close>= a+b and close < (a+b+dat/2) THEN
DRAWTEXT ("Allegement",100+X,Y-20,Dialog,Bold,15)anchor(bottomleft ) coloured(0,180,180,255)
endif
if close> a+b+dat THEN
DRAWTEXT ("Vente Forte",100+X,Y-20,Dialog,Bold,15)anchor(bottomleft ) coloured(250,0,0,255)
endif
if close>= a+b+dat/2 and close<= a+b+dat THEN
DRAWTEXT ("Vente",100+X,Y-20,Dialog,Bold,15)anchor(bottomleft ) coloured(250,0,0,255)
endif
if close< a+b and close>= (a+b-dat/2)THEN
DRAWTEXT ("Renforcement",100+X,Y-20,Dialog,Bold,15)anchor(bottomleft ) coloured(0,180,180,255)
endif
if close<= a+b-dat/2 and close>(a+b-dat) THEN
DRAWTEXT ("Achat",100+X,Y-20,Dialog,Bold,15)anchor(bottomleft ) coloured(0,150,0,255)
endif
if close<=(a+b-dat) THEN
DRAWTEXT ("Achat Fort",100+X,Y-20,Dialog,Bold,15)anchor(bottomleft ) coloured(0,150,0,255)
endif

/////////////////////////////////////////////////////
return customclose as " Linear regression channel V1 "
Download
Filename:
Linear-Regression-Analytics.itf
Downloads:
185
Senior
Developer by day, aspiring writer by night. Still compiling my bio... Error 404: presentation not found.
Author’s Profile
Loading...