

Linear Regression Channel with FIBONACCI
What is the Linear Regression Channel with Fibonacci?
The Linear Regression Channel is a statistical tool used to identify trends and potential reversal points in the market. By incorporating Fibonacci levels, this tool becomes even more powerful, providing additional support and resistance levels. Understanding and utilizing this combination can significantly enhance your trading strategy.
Coding the Indicator
To begin, we’ll set up the basic parameters and calculate the necessary sums for the Linear Regression Line. Here’s the initial setup:
// Linear Regression Channel with FIBONACCI by Ivan on 30.05.2024

defparam drawonlastbaronly=true
defparam calculateonlastbars=1000
// --- settings
lookback= 200 //channel period
ChannelType = 1 //1= Standard Deviation ; 2= Standard Error
NbDeviation = 1 //Deviation multiplier
colorRed = 255
colorGreen = 255
colorBlue = 0
// --- end of settings

sumx = 0
sumy = 0
sumxy = 0
sumx2 = 0

for cmpt = lookback downto 0 do
    tmpx = cmpt
    tmpy = close[cmpt]
    sumy = sumy + tmpy
    sumx = sumx + tmpx
    sumx2 = sumx2 + (tmpx * tmpx)
    sumxy = sumxy + (tmpy * tmpx)
next

n = lookback + 1

if (sumx2 = sumx * sumx) then // protection to avoid infinite values
    b = sumxy - sumx * sumy
else
    b = (n * sumxy - sumx * sumy) / (n * sumx2 - sumx * sumx)
endif
a = (sumy - b * sumx) / n
This code sets up the parameters for the lookback period, channel type, and deviation multiplier, and calculates the sums needed for the Linear Regression Line.
Drawing the Regression Channel with Fibonacci Levels
Next, we will draw the regression channel and overlay Fibonacci levels. The following code does just that:
// Channel
if ChannelType = 1 then //Standard Deviation
    dat = std[lookback] * NbDeviation
else
    dat = ste[lookback] * NbDeviation
endif

drawsegment(barindex[lookback], (a + b * lookback) + dat, barindex, a + b * 0 + dat) coloured(colorRed, colorGreen, colorBlue) style(line, 4) coloured("yellow")
drawsegment(barindex[lookback], (a + b * lookback) + 0.618 * dat, barindex, a + b * 0 + 0.618 * dat) coloured(colorRed, colorGreen, colorBlue) style(dottedline, 4) coloured("green")
drawsegment(barindex[lookback], (a + b * lookback) + 0.5 * dat, barindex, a + b * 0 + 0.5 * dat) coloured(colorRed, colorGreen, colorBlue) style(dottedline, 2) coloured("green")
drawsegment(barindex[lookback], (a + b * lookback) + 0.382 * dat, barindex, a + b * 0 + 0.382 * dat) coloured(colorRed, colorGreen, colorBlue) style(dottedline, 2) coloured("green")
drawsegment(barindex[lookback], (a + b * lookback) + 0.236 * dat, barindex, a + b * 0 + 0.236 * dat) coloured(colorRed, colorGreen, colorBlue) style(dottedline, 2) coloured("green")
drawsegment(barindex[lookback], a + b * lookback, barindex, a + b * 0) coloured(colorRed, colorGreen, colorBlue) style(dottedline, 5) coloured("blue")
drawsegment(barindex[lookback], (a + b * lookback) - 0.236 * dat, barindex, a + b * 0 - 0.236 * dat) coloured(colorRed, colorGreen, colorBlue) style(dottedline, 2) coloured("red")
drawsegment(barindex[lookback], (a + b * lookback) - 0.382 * dat, barindex, a + b * 0 - 0.382 * dat) coloured(colorRed, colorGreen, colorBlue) style(dottedline, 2) coloured("red")
drawsegment(barindex[lookback], (a + b * lookback) - 0.5 * dat, barindex, a + b * 0 - 0.5 * dat) coloured(colorRed, colorGreen, colorBlue) style(dottedline, 2) coloured("red")
drawsegment(barindex[lookback], (a + b * lookback) - 0.618 * dat, barindex, a + b * 0 - 0.618 * dat) coloured(colorRed, colorGreen, colorBlue) style(dottedline, 4) coloured("red")
drawsegment(barindex[lookback], (a + b * lookback) - dat, barindex, a + b * 0 - dat) coloured(colorRed, colorGreen, colorBlue) style(line, 4) coloured("yellow")

Return customclose as "REGRESSION LINEAIRE + FIBO"
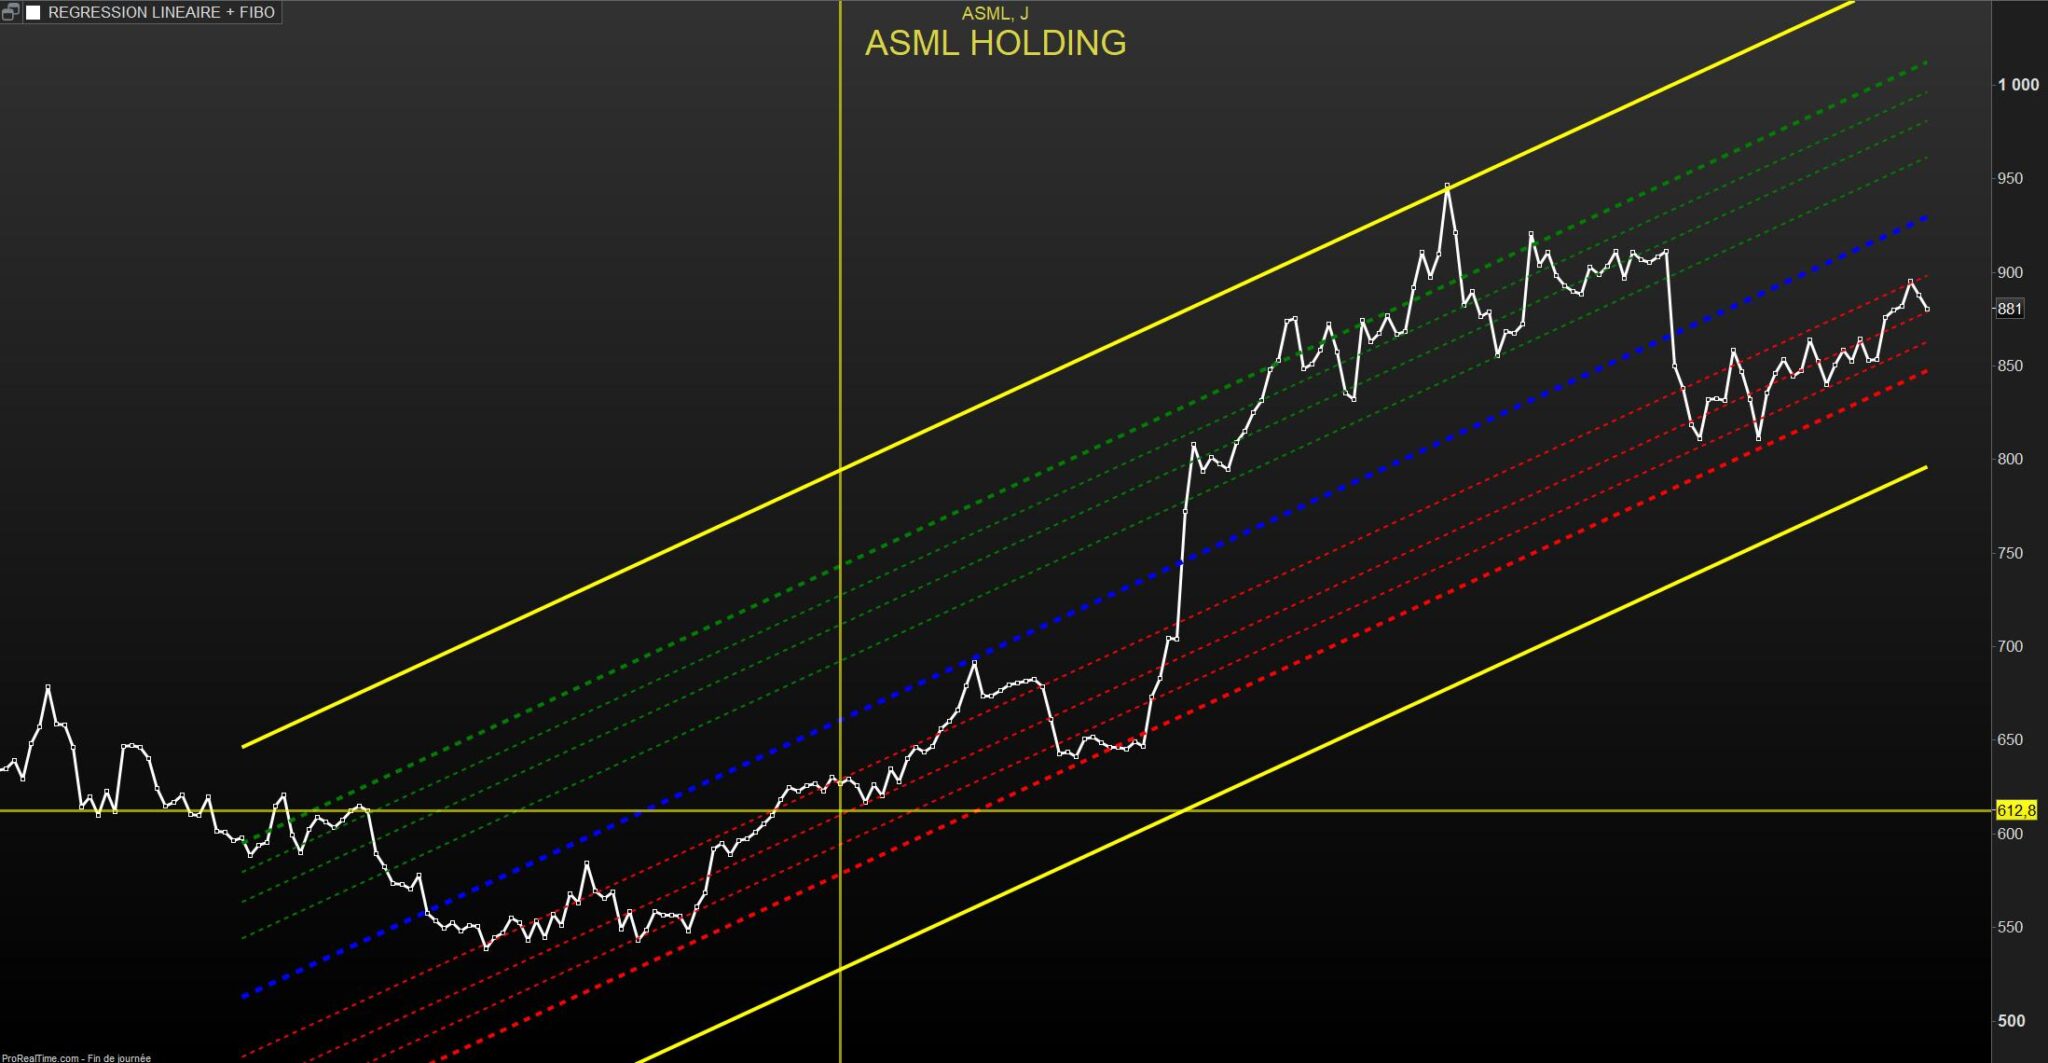
This code draws the main regression line and the channels above and below it, using Fibonacci retracement levels (0.618, 0.5, 0.382, 0.236). Each level is colored and styled to help distinguish between them visually.
Practical Application
Using the Linear Regression Channel with Fibonacci in your trading can provide you with critical insights into market trends and potential reversal points. The standard deviation channels give you a sense of volatility, while the Fibonacci levels provide precise areas of support and resistance. By integrating these tools into your analysis, you can make more informed trading decisions and enhance your overall strategy.
Conclusion
Mastering the Linear Regression Channel with Fibonacci in ProRealTime can significantly boost your trading analysis. This combination helps you visualize market trends and potential reversal points, making your trading strategy more robust. Get started with this powerful indicator and take your trading to the next level!
If you have any questions or need further assistance, don’t hesitate to reach out. Happy trading!
Complete code:
// REGRESSION LINEAIRE DROITE + FIBONACCI by Ivan le 30.05.2024

//PRC_Std and Ste LinRegChannel  indicator
//Standard Deviation and Standard Error
//Linear Regression Channel //12.03.2019
//Nicolas @ www.prorealcode.com //Sharing ProRealTime knowledge
// Modifié par IVAN le 30.05.2024 (Fibo)


defparam drawonlastbaronly=true
defparam calculateonlastbars=1000
// --- settings
lookback= 200 //channel period
ChannelType = 1 //1= Standard Deviation ; 2= Standard Erro
NbDeviation = 1 //Deviation multiplier
colorRed = 255
colorGreen = 255
colorBlue = 0
// --- end of settings

sumx = 0
sumy = 0
sumxy = 0
sumx2 = 0

for cmpt = lookback downto 0 do
tmpx = cmpt
tmpy = close[cmpt]
sumy = sumy+tmpy
sumx = sumx+tmpx
sumx2 = sumx2 + (tmpx*tmpx)
sumxy = sumxy + (tmpy*tmpx)
next

n = lookback+1

if (sumx2 = sumx * sumx) then // protection to avoid infinite values
b = sumxy - sumx * sumy
else
b = (n * sumxy - sumx * sumy) / (n * sumx2 - sumx * sumx)
endif
a = (sumy - b * sumx) / n
/////////////////////////////////////////

//channel
if ChannelType = 1 then //Standard Deviation
dat = std[lookback]*NbDeviation
else
dat = ste[lookback]*NbDeviation
endif

drawsegment(barindex[lookback],(a+b*lookback)+dat,barindex,a+b*0+dat) coloured(colorRed,colorGreen,colorBlue)style(line,4)coloured("yellow")
drawsegment(barindex[lookback],(a+b*lookback)+0.618*dat,barindex,a+b*0+0.618*dat) coloured(colorRed,colorGreen,colorBlue)style(dottedline,4)coloured("green")
drawsegment(barindex[lookback],(a+b*lookback)+0.5*dat,barindex,a+b*0+0.5*dat) coloured(colorRed,colorGreen,colorBlue)style(dottedline,2)coloured("green")
drawsegment(barindex[lookback],(a+b*lookback)+0.382*dat,barindex,a+b*0+0.382*dat) coloured(colorRed,colorGreen,colorBlue)style(dottedline,2)coloured("green")
drawsegment(barindex[lookback],(a+b*lookback)+0.236*dat,barindex,a+b*0+0.236*dat) coloured(colorRed,colorGreen,colorBlue)style(dottedline,2)coloured("green")
drawsegment(barindex[lookback],a+b*lookback,barindex,a+b*0) coloured(colorRed,colorGreen,colorBlue)style(dottedline,5)coloured("blue")
drawsegment(barindex[lookback],(a+b*lookback)-0.236*dat,barindex,a+b*0-0.236*dat) coloured(colorRed,colorGreen,colorBlue)style(dottedline,2)coloured("red")
drawsegment(barindex[lookback],(a+b*lookback)-0.382*dat,barindex,a+b*0-0.382*dat) coloured(colorRed,colorGreen,colorBlue)style(dottedline,2)coloured("red")
drawsegment(barindex[lookback],(a+b*lookback)-0.5*dat,barindex,a+b*0-0.5*dat) coloured(colorRed,colorGreen,colorBlue)style(dottedline,2)coloured("red")
drawsegment(barindex[lookback],(a+b*lookback)-0.618*dat,barindex,a+b*0-0.618*dat) coloured(colorRed,colorGreen,colorBlue)style(dottedline,4)coloured("red")
drawsegment(barindex[lookback],(a+b*lookback)-dat,barindex,a+b*0-dat) coloured(colorRed,colorGreen,colorBlue)style(line,4)coloured("yellow")

Return customclose as " REGRESSION LINEAIRE + FIBO "