

Last Two Pivots Support and Resistance Lines
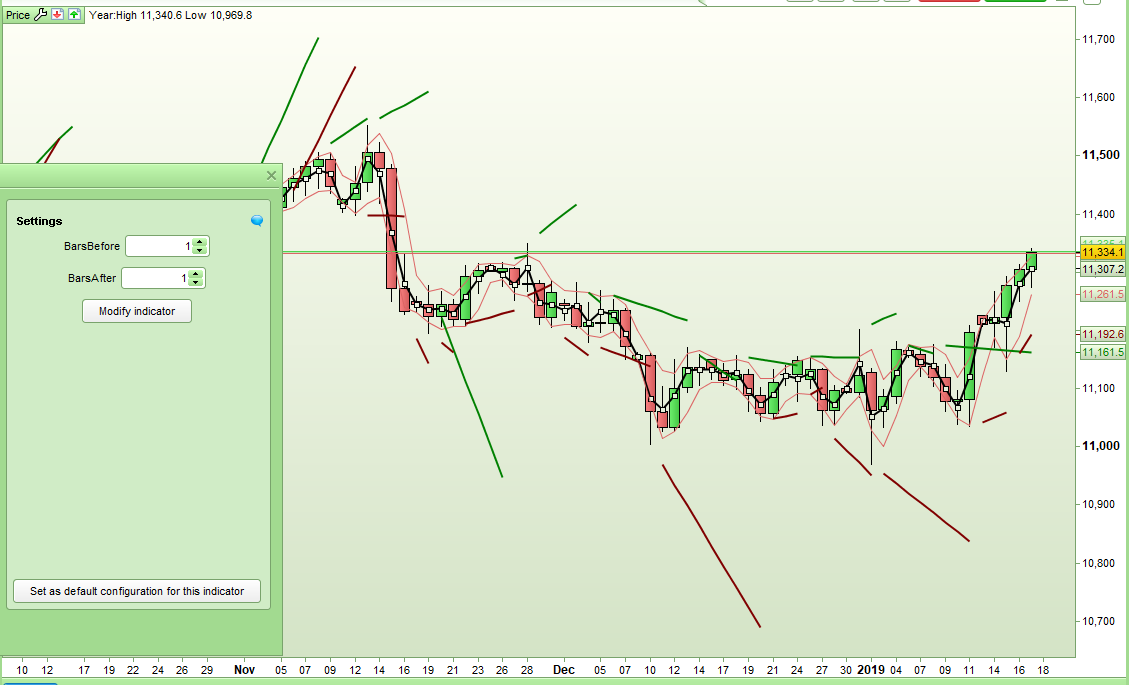
This indicator draws support and resistance lines that are an extension of the last two swing highs and last two swing lows (or fractal points).
The pivot /fractals definition can be adjusted by changing the number of bars before and the number of bars after the high or low. So for example you can have a new pivot whenever a high has one candle lower either side of it or when it has two candles lower either side of it.
Whenever a new pivot point is formed a new support or resistance line starts to be drawn that lines up with the last two pivot points.
This indicator can be used to easily see if price is either bouncing off of the last two pivots support and resistance or if it is breaking out from that support or resistance.
Download and import the ITF file to get full functionality.
//Last Pivots Support and Resistance Lines
//By Vonasi
//17011919

//DEFPARAM CalculateOnLastBars = 1000

//BarsAfter     = 1
//BarsBefore     = 1

BarLookBack  = BarsAfter + 1
IF low[BarsAfter] < lowest[BarsBefore](low)[BarLookBack] THEN
 IF low[BarsAfter] = lowest[BarLookBack](low) THEN
  Support  = low[BarsAfter]
 ENDIF
ENDIF
IF high[BarsAfter] > highest[BarsBefore](high)[BarLookBack] THEN
 IF high[BarsAfter] = highest[BarLookBack](high) THEN
  Resistance = high[BarsAfter]
 ENDIF
ENDIF

cr = 255
cs = 255

if resistance <> resistance[1] then
 hi2 = hi1
 hi2index = hi1index
 hi1 = high[BarsAfter]
 hi1index = BarIndex[BarsAfter]
 cr = 0
endif

if support <> support[1] then
 lo2 = lo1
 lo2index = lo1index
 lo1 = low[BarsAfter]
 lo1index = BarIndex[BarsAfter]
 cs = 0
endif

if hi2 > hi1 then
 nexthi = hi1 - (((hi2 - hi1) / (hi1index - hi2index)) * (barindex - hi1index))
endif

if hi2 < hi1 then
 nexthi = hi1 + (((hi1 - hi2) / (hi1index - hi2index)) * (barindex - hi1index))
endif

if lo2 > lo1 then
 nextlo = lo1 - (((lo2 - lo1) / (lo1index - lo2index)) * (barindex - lo1index))
endif

if lo2 < lo1 then
 nextlo = lo1 + (((lo1 - lo2) / (lo1index - lo2index)) * (barindex - lo1index))
endif

RETURN nexthi coloured(0,128,0,cr) as "Resistance", nextlo coloured (128,0,0,cs) as "Support"