

kNN Market Architecture
Introduction
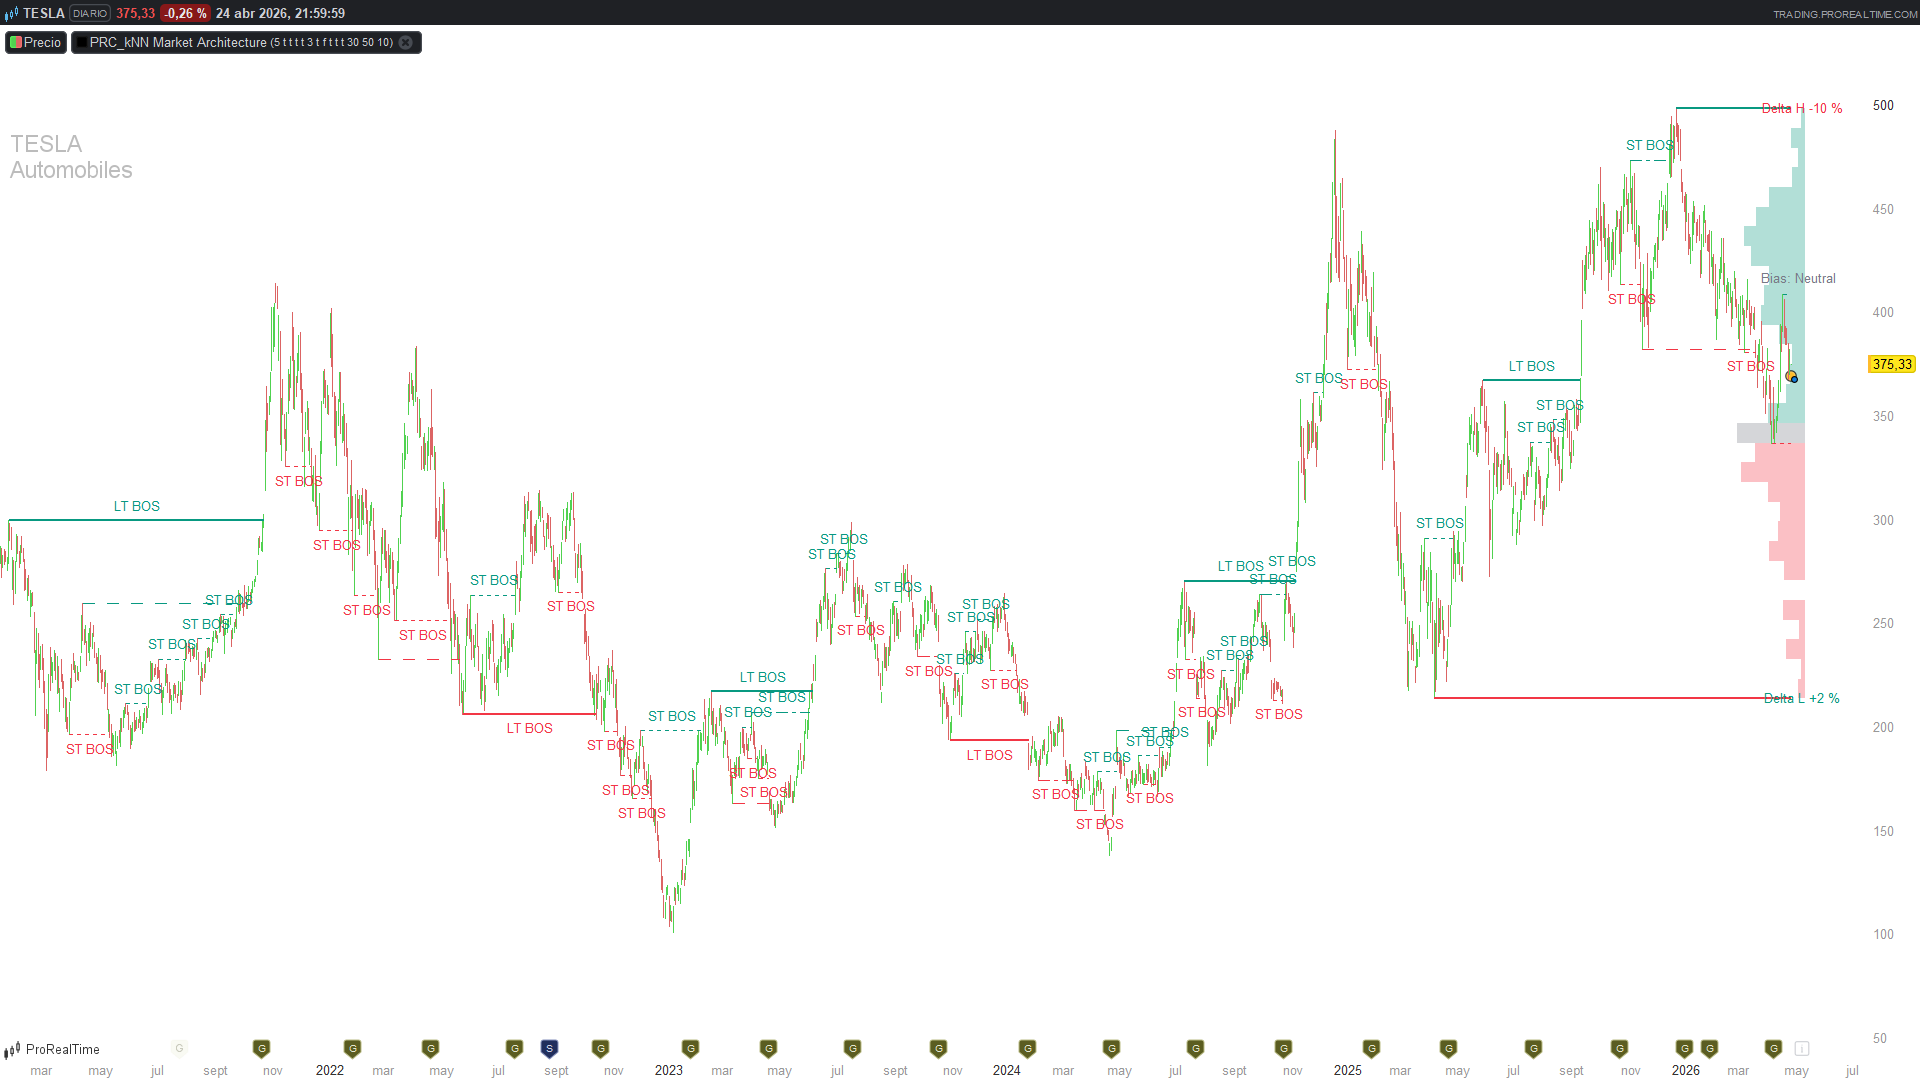
kNN Market Architecture (by LuxAlgo) is a market-structure indicator built around three nested pivot detectors — Short Term (ST), Medium Term (MT) and Long Term (LT) — each one running on a length that the indicator adjusts in real time according to the asset’s relative volatility. Each pivot becomes a horizontal support/resistance line; when price closes through it, the line is terminated with a Break of Structure (BOS) label. A bias is computed from the active term, candles are coloured accordingly, a horizontal volume profile is anchored to the active range, and a “Delta Tank” widget tracks the cumulative buying/selling pressure since the active line was created.
Theory Behind the Indicator
1. Volatility-Adaptive Pivot Length
The base length of the Short-Term pivot detector is recomputed every bar from the ratio between the current 200-period ATR and its own 200-period mean:
volRatio       = ATR(200) / SMA(ATR(200), 200)
smoothedRatio  = EMA(volRatio, 50)
dynMult        = smoothedRatio ^ 1.5             // when autoSensitivity = 1
baseLen        = max(3, round((11 - sensitivity) * dynMult))
When the market is twice as volatile as its own recent average (smoothedRatio = 2), the multiplier becomes 2^1.5 ≈ 2.83 and the pivot length scales up by the same factor. The intuition is straightforward: in a noisy regime you want pivots confirmed over a wider window; in a calm regime a tighter window suffices. The exponent of 1.5 is super-linear, so the system biases towards more confirmation when volatility expands.
The Medium-Term and Long-Term lengths are simple multiples of the base:
mtLen = baseLen × 3
ltLen = mtLen × 3 = baseLen × 9
This 3× ratio is what makes the three terms feel like genuinely separate scales — a Long-Term pivot needs a window roughly an order of magnitude wider than a Short-Term one to register, so they pick up qualitatively different swings rather than just three views of the same pivots.
2. Pivot Detection
ProBuilder has no built-in pivot detector, so the standard idiom is used: a bar at offset n from the current bar is a pivot high if its high value is the maximum in the window [high[0], …, high[2n]]. The check is implemented with highest[2n+1](high) and a strict comparison against immediate neighbours to avoid spurious pivots on flat tops:
if high[len] = highest[2*len+1](high) and high[len] > high[len+1] and high[len] >= high[len-1] then
    // pivot high confirmed at bar (barindex - len)
endif
The same logic, mirrored, detects pivot lows. This is run once per bar for each of the three terms.
3. Active Lines and BOS
For every (term, direction) combination the indicator keeps a single active line — the horizontal level of the most recent unbroken pivot. When a new pivot is detected, the previous active line is silently replaced (it never gets drawn). When the close crosses through the active line, the line is terminated as a BOS:
- The closing bar’s index becomes the right end of the segment.
- A “ST BOS” / “MT BOS” / “LT BOS” label is drawn at the segment’s midpoint.
- The active line slot is freed for the next pivot.
This produces three cleanly separated structural views of the same chart, each with its own BOS history. The default colour scheme uses bullish green (#089981) for resistance breaks and bearish red (#f23645) for support breaks. Line styles distinguish the term:
- ST: dotted, thin
- MT: dashed, thin
- LT: solid, thick
4. Bias and the “Selected Term”
A user input chooses which term drives the bias:
- close > selectedHigh → bullish
- close < selectedLow → bearish
- otherwise → neutral
The bias drives two things: (a) the candle colouring (a separate companion indicator — see below), and (b) the volume profile range and the Delta Tank attribution.
5. Volume Profile, Anchored Dynamically
The volume profile is built between selectedHigh and selectedLow of the active term, divided into vpRows price bins (default 30). The lookback is bounded by the position of the most recent active pivot of the same term, so the profile naturally tightens around the current structure rather than spanning the whole history.
Each bar’s volume is added in full to the bin containing its close price (the per-bar wick distribution that more sophisticated profile indicators use is not part of this study; the original applies the same simplification). The bin with the highest volume is the Point of Control (POC) and gets a neutral grey rectangle; bins above the POC are tinted bullish-green; bins below are bearish-red. Rectangle width is proportional to the bin’s share of the maximum.
6. The Delta Tank
For the active line of the selected term, the Delta Tank accumulates volume and “delta” (signed volume — positive on green bars, negative on red bars) from the bar where the line was created until the current bar:
deltaPct = abs(cumDelta) / cumVol × 100
sign = + if cumDelta ≥ 0 else −
7. The kNN Classifier — A Closer Look
The pinescript’s kNN filter never rejects a pivot. Every detected pivot becomes a line. The classifier as wired in the source is a placebo.
Rather than carry that placebo into ProBuilder, this translation ships the kNN scaffolding as an opt-in extension with a real score plugged in: the percentile rank of the pivot bar’s volume in a rolling 100-bar window. The default is useKnn = 0 (off), so out-of-the-box behaviour matches the Pine original. The filter, the rationale for choosing percentile rank over a few alternatives that were tested and rejected, and empirical results across four asset classes are documented in the Appendix at the end of this article.
How to Read the Indicator
- The three line styles tell you which structural scale you are looking at. ST (dotted) is intra-day chop; MT (dashed) is the swing within a session or two; LT (solid, bold) is the higher-timeframe structure. By default, only ST and LT show their BOS labels; MT shows the lines silently — exactly as the LuxAlgo original ships. Activate showMTBOS = 1 if you want the middle scale labelled too.
- A BOS is information, not a signal. It tells you that a pivot has been broken; the colour tells you in which direction. It does not tell you the broken pivot will not be re-tested or the breakout will not fail — it just records what happened. The active line is the one to watch; the BOS line is history.
- The bias label in the top right collapses the active term’s state into a single word — useful when you have the chart open in a corner of a screen and want to see the regime at a glance.
- The Delta Tank percentage is a commitment read on the active line. A line at price 100 with Delta H +85% means since the pivot was formed, 85 % of the cumulative volume has been buying-pressure-positive — buyers have been in control. A Delta H -10% is roughly balanced. The number lets you discriminate between two visually identical lines: one that price has been respectfully consolidating under, and one that has been sold into aggressively.
- The volume profile marks where transactions have actually happened inside the active range. The POC is the price that has seen the most volume — typically a magnet on retests. The bins above and below the POC, coloured by side, give a sense of where the bulk of activity is concentrated relative to the centre of mass.
Practical Applications
- Trend-with-structure entries. Use the LT bias as a regime filter (only long when bias is bullish), and ST or MT BOS in the bias direction as entry triggers. The volatility-adaptive length means the indicator stays usable across very different instruments without re-tuning.
- Liquidity-aware position sizing. The Delta Tank lets you avoid sitting under a long-active resistance line that has been bought into hard (Delta H ≥ +60%) versus one that has been distributed under (Delta H ≤ −20%). Same line, very different stories.
- Profile-anchored stops. The volume profile’s POC is often a rational stop reference: an LT-anchored profile inside which the POC has shifted up means the centre of recent activity is rising, and a stop just below the POC tracks that shift.
- Multi-timeframe sanity check. Run the indicator on a daily chart with biasSource = 3 (LT) and on an hourly chart with biasSource = 1 (ST). Trade only when both biases agree. The translation is cheap enough computationally to run on both at once.
Code
The indicator ships as two scripts, both required for the full visual experience. The first one — the structural engine — is loaded as the main indicator. The second one — the candle colourer — is loaded on the same chart with the same key inputs, to recolour the bars by bias. Loading only the first is fine if you do not want bar colouring; loading only the second is also fine if you only want the bias colouring without the lines.
Indicator 1/2 — Structure, BOS, Profile, Delta Tank
//----------------------------------------------
//PRC_kNN Market Architecture [LuxAlgo]
//Indicador 1/2 — estructura, BOS, profile, delta tank, kNN filter (opt-in)
//version = 2
//27.04.2026
//Iván González @ www.prorealcode.com
//Sharing ProRealTime knowledge
//----------------------------------------------
defparam drawonlastbaronly = true
defparam calculateonlastbars = 1500

// === INPUTS ===
sensitivityInput = 5
autoSensitivity  = 1

showST           = 1
showMT           = 1
showLT           = 1
biasSource       = 3

showSTBOS        = 1
showMTBOS        = 0
showLTBOS        = 1

showDeltaTank    = 1
showVP           = 1
vpRows           = 30
vpWidth          = 50
vpOffset         = 10

stOffsetMult     = 0.5
mtOffsetMult     = 1.5
ltOffsetMult     = 2.5

// Optional kNN filter (applied to LT term only).
// Replaces the placebo "kNN classifier" of the Pine original (score=1.0 hardcoded)
// with a real score: percentile rank of pivot bar volume, autocalibrated per asset.
useKnn           = 0     // 0=off (default), 1=filter LT pivots with kNN
knnK             = 5
knnThreshold     = 0.7   // minimum percentile (0.7 = top 30% of volume)
pctWindow        = 100   // percentile rank window (bars before pivot)

// === COLOURS (RGB) ===
bullR = 8
bullG = 153
bullB = 129
bearR = 242
bearG = 54
bearB = 69
neuR  = 120
neuG  = 123
neuB  = 134

// === DYNAMIC ENGINE ===
atrLong = averagetruerange[200]
avgAtrL = average[200](atrLong)
if avgAtrL > 0 then
   volRatio = atrLong / avgAtrL
else
   volRatio = 1.0
endif
smoothedRatio = exponentialaverage[50](volRatio)

if autoSensitivity = 1 and smoothedRatio > 0 then
   dynMult = exp(1.5 * log(smoothedRatio))
else
   dynMult = 1.0
endif

baseLen = max(3, round((11 - sensitivityInput) * dynMult))
mtLen   = baseLen * 3
ltLen   = mtLen * 3

atr14 = averagetruerange[14]
stOffset = atr14 * stOffsetMult
mtOffset = atr14 * mtOffsetMult
ltOffset = atr14 * ltOffsetMult

// Features for the kNN scoring (relAtr and relVol of current bar)
avgAtr14 = average[100](atr14)
if avgAtr14 > 0 then
   relAtr = atr14 / avgAtr14
else
   relAtr = 1.0
endif

avg100Vol = average[100](volume)
if avg100Vol > 0 then
   relVol = volume / avg100Vol
else
   relVol = 1.0
endif

// === PERSISTENT STATE ===
once stB = 0
once mtB = 0
once ltB = 0
once stHactive = 0
once stLactive = 0
once mtHactive = 0
once mtLactive = 0
once ltHactive = 0
once ltLactive = 0
once stHy = 0
once stHx = 0
once stLy = 0
once stLx = 0
once mtHy = 0
once mtHx = 0
once mtLy = 0
once mtLx = 0
once ltHy = 0
once ltHx = 0
once ltLy = 0
once ltLx = 0
once lastSTHigh = 0
once lastSTLow  = 0
once lastMTHigh = 0
once lastMTLow  = 0
once lastLTHigh = 0
once lastLTLow  = 0

// kNN history for the LT filter
once ltHistCount = 0

// === ST: pivots + BOS ===
stPHfound = 0
stPLfound = 0
if barindex > 2*baseLen + 1 then
   if high[baseLen] = highest[2*baseLen+1](high) and high[baseLen] > high[baseLen+1] and high[baseLen] >= high[baseLen-1] then
      stPHfound = 1
   endif
   if low[baseLen] = lowest[2*baseLen+1](low) and low[baseLen] < low[baseLen+1] and low[baseLen] <= low[baseLen-1] then
      stPLfound = 1
   endif
endif

if stPHfound = 1 then
   stHy = high[baseLen]
   stHx = barindex - baseLen
   stHactive = 1
   lastSTHigh = stHy
endif
if stPLfound = 1 then
   stLy = low[baseLen]
   stLx = barindex - baseLen
   stLactive = 1
   lastSTLow = stLy
endif

if stHactive = 1 and close > stHy then
   $stBosX1[stB] = stHx
   $stBosX2[stB] = barindex
   $stBosY[stB]  = stHy
   $stBosDir[stB] = 1
   stB = stB + 1
   stHactive = 0
endif
if stLactive = 1 and close < stLy then
   $stBosX1[stB] = stLx
   $stBosX2[stB] = barindex
   $stBosY[stB]  = stLy
   $stBosDir[stB] = -1
   stB = stB + 1
   stLactive = 0
endif

// === MT ===
mtPHfound = 0
mtPLfound = 0
if barindex > 2*mtLen + 1 then
   if high[mtLen] = highest[2*mtLen+1](high) and high[mtLen] > high[mtLen+1] and high[mtLen] >= high[mtLen-1] then
      mtPHfound = 1
   endif
   if low[mtLen] = lowest[2*mtLen+1](low) and low[mtLen] < low[mtLen+1] and low[mtLen] <= low[mtLen-1] then
      mtPLfound = 1
   endif
endif

if mtPHfound = 1 then
   mtHy = high[mtLen]
   mtHx = barindex - mtLen
   mtHactive = 1
   lastMTHigh = mtHy
endif
if mtPLfound = 1 then
   mtLy = low[mtLen]
   mtLx = barindex - mtLen
   mtLactive = 1
   lastMTLow = mtLy
endif

if mtHactive = 1 and close > mtHy then
   $mtBosX1[mtB] = mtHx
   $mtBosX2[mtB] = barindex
   $mtBosY[mtB]  = mtHy
   $mtBosDir[mtB] = 1
   mtB = mtB + 1
   mtHactive = 0
endif
if mtLactive = 1 and close < mtLy then
   $mtBosX1[mtB] = mtLx
   $mtBosX2[mtB] = barindex
   $mtBosY[mtB]  = mtLy
   $mtBosDir[mtB] = -1
   mtB = mtB + 1
   mtLactive = 0
endif

// === LT ===
ltPHfound = 0
ltPLfound = 0
if barindex > 2*ltLen + 1 then
   if high[ltLen] = highest[2*ltLen+1](high) and high[ltLen] > high[ltLen+1] and high[ltLen] >= high[ltLen-1] then
      ltPHfound = 1
   endif
   if low[ltLen] = lowest[2*ltLen+1](low) and low[ltLen] < low[ltLen+1] and low[ltLen] <= low[ltLen-1] then
      ltPLfound = 1
   endif
endif

// === Optional kNN filter for LT (see Appendix) ===
// Replaces the placebo "kNN classifier" of the Pine original with a real score:
// percentile rank of the pivot bar's volume over the previous pctWindow bars.
// If the kNN score is below threshold, the pivot is suppressed (no active line).
if useKnn = 1 and (ltPHfound = 1 or ltPLfound = 1) then
   curFeat1 = relAtr[ltLen]
   curFeat2 = relVol[ltLen]
   volPivot = volume[ltLen]

   // 1) Score = percentile rank of pivot bar volume in previous pctWindow bars
   maxBack = barindex - ltLen
   if maxBack > pctWindow then
      maxBack = pctWindow
   endif
   if maxBack >= 20 then
      pctCount = 0
      for jPct = 0 to maxBack - 1 do
         if volume[ltLen + jPct] <= volPivot then
            pctCount = pctCount + 1
         endif
      next
      curScore = pctCount / maxBack
   else
      curScore = relVol[ltLen]
   endif

   // 2) kNN score = average of K nearest neighbours' scores in feature-space
   if ltHistCount < knnK then
      knnScoreLT = 0.5
   else
      for iKnn = 0 to ltHistCount - 1 do
         $ltDist[iKnn]    = abs(curFeat1 - $ltHF1[iKnn]) + abs(curFeat2 - $ltHF2[iKnn])
         $ltSortIdx[iKnn] = iKnn
      next

      for iiKnn = 0 to knnK - 1 do
         for jjKnn = iiKnn + 1 to ltHistCount - 1 do
            idxI = $ltSortIdx[iiKnn]
            idxJ = $ltSortIdx[jjKnn]
            if $ltDist[idxJ] < $ltDist[idxI] then
               $ltSortIdx[iiKnn] = idxJ
               $ltSortIdx[jjKnn] = idxI
            endif
         next
      next

      sumKnn = 0
      for kKnn = 0 to knnK - 1 do
         kIdx = $ltSortIdx[kKnn]
         sumKnn = sumKnn + $ltHSc[kIdx]
      next
      knnScoreLT = sumKnn / knnK
   endif

   // 3) Push to history (always, FIFO 100)
   if ltHistCount >= 100 then
      for shKnn = 0 to 98 do
         $ltHF1[shKnn] = $ltHF1[shKnn+1]
         $ltHF2[shKnn] = $ltHF2[shKnn+1]
         $ltHSc[shKnn] = $ltHSc[shKnn+1]
      next
      $ltHF1[99] = curFeat1
      $ltHF2[99] = curFeat2
      $ltHSc[99] = curScore
   else
      $ltHF1[ltHistCount] = curFeat1
      $ltHF2[ltHistCount] = curFeat2
      $ltHSc[ltHistCount] = curScore
      ltHistCount = ltHistCount + 1
   endif

   // 4) Apply filter: suppress pivot if score < threshold
   if knnScoreLT < knnThreshold then
      ltPHfound = 0
      ltPLfound = 0
   endif
endif

if ltPHfound = 1 then
   ltHy = high[ltLen]
   ltHx = barindex - ltLen
   ltHactive = 1
   lastLTHigh = ltHy
endif
if ltPLfound = 1 then
   ltLy = low[ltLen]
   ltLx = barindex - ltLen
   ltLactive = 1
   lastLTLow = ltLy
endif

if ltHactive = 1 and close > ltHy then
   $ltBosX1[ltB] = ltHx
   $ltBosX2[ltB] = barindex
   $ltBosY[ltB]  = ltHy
   $ltBosDir[ltB] = 1
   ltB = ltB + 1
   ltHactive = 0
endif
if ltLactive = 1 and close < ltLy then
   $ltBosX1[ltB] = ltLx
   $ltBosX2[ltB] = barindex
   $ltBosY[ltB]  = ltLy
   $ltBosDir[ltB] = -1
   ltB = ltB + 1
   ltLactive = 0
endif

// === BIAS ===
if biasSource = 1 then
   selectedHigh = lastSTHigh
   selectedLow  = lastSTLow
elsif biasSource = 2 then
   selectedHigh = lastMTHigh
   selectedLow  = lastMTLow
elsif biasSource = 3 then
   selectedHigh = lastLTHigh
   selectedLow  = lastLTLow
else
   selectedHigh = 0
   selectedLow  = 0
endif

biasState = 0
if selectedHigh > 0 and selectedLow > 0 then
   if close > selectedHigh then
      biasState = 1
   elsif close < selectedLow then
      biasState = -1
   endif
endif

// === RENDERING (last bar only) ===
if islastbarupdate then

   // ST: active line + BOS
   if showST = 1 then
      if stHactive = 1 then
         drawsegment(stHx, stHy, barindex, stHy) coloured(bullR, bullG, bullB) style(dottedline, 1)
      endif
      if stLactive = 1 then
         drawsegment(stLx, stLy, barindex, stLy) coloured(bearR, bearG, bearB) style(dottedline, 1)
      endif
      for i = 0 to stB - 1 do
         if $stBosDir[i] = 1 then
            drawsegment($stBosX1[i], $stBosY[i], $stBosX2[i], $stBosY[i]) coloured(bullR, bullG, bullB) style(dottedline, 1)
            if showSTBOS = 1 then
               midX = round(($stBosX1[i] + $stBosX2[i]) / 2)
               drawtext("ST BOS", midX, $stBosY[i] + stOffset) coloured(bullR, bullG, bullB)
            endif
         else
            drawsegment($stBosX1[i], $stBosY[i], $stBosX2[i], $stBosY[i]) coloured(bearR, bearG, bearB) style(dottedline, 1)
            if showSTBOS = 1 then
               midX = round(($stBosX1[i] + $stBosX2[i]) / 2)
               drawtext("ST BOS", midX, $stBosY[i] - stOffset) coloured(bearR, bearG, bearB)
            endif
         endif
      next
   endif

   // MT: active line + BOS
   if showMT = 1 then
      if mtHactive = 1 then
         drawsegment(mtHx, mtHy, barindex, mtHy) coloured(bullR, bullG, bullB) style(dottedline2, 1)
      endif
      if mtLactive = 1 then
         drawsegment(mtLx, mtLy, barindex, mtLy) coloured(bearR, bearG, bearB) style(dottedline2, 1)
      endif
      for i = 0 to mtB - 1 do
         if $mtBosDir[i] = 1 then
            drawsegment($mtBosX1[i], $mtBosY[i], $mtBosX2[i], $mtBosY[i]) coloured(bullR, bullG, bullB) style(dottedline2, 1)
            if showMTBOS = 1 then
               midX = round(($mtBosX1[i] + $mtBosX2[i]) / 2)
               drawtext("MT BOS", midX, $mtBosY[i] + mtOffset) coloured(bullR, bullG, bullB)
            endif
         else
            drawsegment($mtBosX1[i], $mtBosY[i], $mtBosX2[i], $mtBosY[i]) coloured(bearR, bearG, bearB) style(dottedline2, 1)
            if showMTBOS = 1 then
               midX = round(($mtBosX1[i] + $mtBosX2[i]) / 2)
               drawtext("MT BOS", midX, $mtBosY[i] - mtOffset) coloured(bearR, bearG, bearB)
            endif
         endif
      next
   endif

   // LT: active line + BOS
   if showLT = 1 then
      if ltHactive = 1 then
         drawsegment(ltHx, ltHy, barindex, ltHy) coloured(bullR, bullG, bullB) style(line, 2)
      endif
      if ltLactive = 1 then
         drawsegment(ltLx, ltLy, barindex, ltLy) coloured(bearR, bearG, bearB) style(line, 2)
      endif
      for i = 0 to ltB - 1 do
         if $ltBosDir[i] = 1 then
            drawsegment($ltBosX1[i], $ltBosY[i], $ltBosX2[i], $ltBosY[i]) coloured(bullR, bullG, bullB) style(line, 2)
            if showLTBOS = 1 then
               midX = round(($ltBosX1[i] + $ltBosX2[i]) / 2)
               drawtext("LT BOS", midX, $ltBosY[i] + ltOffset) coloured(bullR, bullG, bullB)
            endif
         else
            drawsegment($ltBosX1[i], $ltBosY[i], $ltBosX2[i], $ltBosY[i]) coloured(bearR, bearG, bearB) style(line, 2)
            if showLTBOS = 1 then
               midX = round(($ltBosX1[i] + $ltBosX2[i]) / 2)
               drawtext("LT BOS", midX, $ltBosY[i] - ltOffset) coloured(bearR, bearG, bearB)
            endif
         endif
      next
   endif

   // VOLUME PROFILE (anchored to selected term)
   if showVP = 1 and selectedHigh > 0 and selectedLow > 0 and selectedHigh > selectedLow then
      if biasSource = 1 then
         vpFirstBar = stHx
         if stLx < vpFirstBar then
            vpFirstBar = stLx
         endif
      elsif biasSource = 2 then
         vpFirstBar = mtHx
         if mtLx < vpFirstBar then
            vpFirstBar = mtLx
         endif
      else
         vpFirstBar = ltHx
         if ltLx < vpFirstBar then
            vpFirstBar = ltLx
         endif
      endif
      vpLook = barindex - vpFirstBar
      if vpLook > 499 then
         vpLook = 499
      endif
      if vpLook < 30 then
         vpLook = 30
      endif

      vpRange = selectedHigh - selectedLow
      vpStep  = vpRange / vpRows

      for i = 0 to vpRows - 1 do
         $vpBin[i] = 0
      next

      for i = 0 to vpLook do
         priceI = close[i]
         if priceI >= selectedLow and priceI <= selectedHigh then
            binIdx = floor((priceI - selectedLow) / vpStep)
            if binIdx > vpRows - 1 then
               binIdx = vpRows - 1
            endif
            if binIdx < 0 then
               binIdx = 0
            endif
            $vpBin[binIdx] = $vpBin[binIdx] + volume[i]
         endif
      next

      maxV = 0
      pocIdx = 0
      for i = 0 to vpRows - 1 do
         if $vpBin[i] > maxV then
            maxV = $vpBin[i]
            pocIdx = i
         endif
      next

      if maxV > 0 then
         vpRight = barindex + vpOffset
         for i = 0 to vpRows - 1 do
            v = $vpBin[i]
            if v > 0 then
               binBot = selectedLow + i * vpStep
               binTop = binBot + vpStep
               binW = round((v / maxV) * vpWidth)
               vpLeft = vpRight - binW
               if i = pocIdx then
                  bcR = neuR
                  bcG = neuG
                  bcB = neuB
               elsif i > pocIdx then
                  bcR = bullR
                  bcG = bullG
                  bcB = bullB
               else
                  bcR = bearR
                  bcG = bearG
                  bcB = bearB
               endif
               drawrectangle(vpLeft, binTop, vpRight, binBot) coloured(bcR, bcG, bcB, 0) fillcolor(bcR, bcG, bcB, 80)
            endif
         next
      endif
   endif

   // DELTA TANK
   if showDeltaTank = 1 and biasSource <> 0 then
      if biasSource = 1 then
         dtHact = stHactive
         dtHx   = stHx
         dtHy   = stHy
         dtLact = stLactive
         dtLx   = stLx
         dtLy   = stLy
      elsif biasSource = 2 then
         dtHact = mtHactive
         dtHx   = mtHx
         dtHy   = mtHy
         dtLact = mtLactive
         dtLx   = mtLx
         dtLy   = mtLy
      else
         dtHact = ltHactive
         dtHx   = ltHx
         dtHy   = ltHy
         dtLact = ltLactive
         dtLx   = ltLx
         dtLy   = ltLy
      endif

      if dtHact = 1 then
         barsBackH = barindex - dtHx
         if barsBackH > 0 and barsBackH < 500 then
            cumVolH = 0
            cumDeltaH = 0
            for i = 0 to barsBackH do
               cumVolH = cumVolH + volume[i]
               if close[i] > open[i] then
                  cumDeltaH = cumDeltaH + volume[i]
               elsif close[i] < open[i] then
                  cumDeltaH = cumDeltaH - volume[i]
               endif
            next
            if cumVolH > 0 then
               deltaPctH = round(abs(cumDeltaH) / cumVolH * 100)
               if cumDeltaH >= 0 then
                  drawtext("Delta H +#deltaPctH#%", barindex + 8, dtHy) coloured(bullR, bullG, bullB)
               else
                  drawtext("Delta H -#deltaPctH#%", barindex + 8, dtHy) coloured(bearR, bearG, bearB)
               endif
            endif
         endif
      endif

      if dtLact = 1 then
         barsBackL = barindex - dtLx
         if barsBackL > 0 and barsBackL < 500 then
            cumVolL = 0
            cumDeltaL = 0
            for i = 0 to barsBackL do
               cumVolL = cumVolL + volume[i]
               if close[i] > open[i] then
                  cumDeltaL = cumDeltaL + volume[i]
               elsif close[i] < open[i] then
                  cumDeltaL = cumDeltaL - volume[i]
               endif
            next
            if cumVolL > 0 then
               deltaPctL = round(abs(cumDeltaL) / cumVolL * 100)
               if cumDeltaL >= 0 then
                  drawtext("Delta L +#deltaPctL#%", barindex + 8, dtLy) coloured(bullR, bullG, bullB)
               else
                  drawtext("Delta L -#deltaPctL#%", barindex + 8, dtLy) coloured(bearR, bearG, bearB)
               endif
            endif
         endif
      endif
   endif

   // BIAS LABEL
   if biasSource <> 0 then
      if biasState = 1 then
         drawtext("Bias: Bullish", barindex + 5, high + 3*atr14) coloured(bullR, bullG, bullB)
      elsif biasState = -1 then
         drawtext("Bias: Bearish", barindex + 5, high + 3*atr14) coloured(bearR, bearG, bearB)
      else
         drawtext("Bias: Neutral", barindex + 5, high + 3*atr14) coloured(neuR, neuG, neuB)
      endif
   endif

endif

return
Indicator 2/2 — Bar Coloring
Load this on the same chart as the first indicator, with matching `sensitivityInput`, `autoSensitivity` and `biasSource` values.
//----------------------------------------------
//PRC_kNN Market Architecture [LuxAlgo] - Bar Coloring
//Indicador 2/2 — solo coloreado de velas
//version = 1
//27.04.2026
//Iván González @ www.prorealcode.com
//Sharing ProRealTime knowledge
//----------------------------------------------
defparam calculateonlastbars = 1500

// === INPUTS (must match Indicator 1/2) ===
sensitivityInput = 5
autoSensitivity  = 1
biasSource       = 3

// === COLOURS (RGB) ===
bullR = 8
bullG = 153
bullB = 129
bearR = 242
bearG = 54
bearB = 69
neuR  = 120
neuG  = 123
neuB  = 134

// === DYNAMIC ENGINE ===
atrLong = averagetruerange[200]
avgAtrL = average[200](atrLong)
if avgAtrL > 0 then
   volRatio = atrLong / avgAtrL
else
   volRatio = 1.0
endif
smoothedRatio = exponentialaverage[50](volRatio)

if autoSensitivity = 1 and smoothedRatio > 0 then
   dynMult = exp(1.5 * log(smoothedRatio))
else
   dynMult = 1.0
endif

baseLen = max(3, round((11 - sensitivityInput) * dynMult))
mtLen   = baseLen * 3
ltLen   = mtLen * 3

// === STATE ===
once lastSTHigh = 0
once lastSTLow  = 0
once lastMTHigh = 0
once lastMTLow  = 0
once lastLTHigh = 0
once lastLTLow  = 0

// === LATEST PIVOTS PER TERM ===
if barindex > 2*baseLen + 1 then
   if high[baseLen] = highest[2*baseLen+1](high) and high[baseLen] > high[baseLen+1] and high[baseLen] >= high[baseLen-1] then
      lastSTHigh = high[baseLen]
   endif
   if low[baseLen] = lowest[2*baseLen+1](low) and low[baseLen] < low[baseLen+1] and low[baseLen] <= low[baseLen-1] then
      lastSTLow = low[baseLen]
   endif
endif

if barindex > 2*mtLen + 1 then
   if high[mtLen] = highest[2*mtLen+1](high) and high[mtLen] > high[mtLen+1] and high[mtLen] >= high[mtLen-1] then
      lastMTHigh = high[mtLen]
   endif
   if low[mtLen] = lowest[2*mtLen+1](low) and low[mtLen] < low[mtLen+1] and low[mtLen] <= low[mtLen-1] then
      lastMTLow = low[mtLen]
   endif
endif

if barindex > 2*ltLen + 1 then
   if high[ltLen] = highest[2*ltLen+1](high) and high[ltLen] > high[ltLen+1] and high[ltLen] >= high[ltLen-1] then
      lastLTHigh = high[ltLen]
   endif
   if low[ltLen] = lowest[2*ltLen+1](low) and low[ltLen] < low[ltLen+1] and low[ltLen] <= low[ltLen-1] then
      lastLTLow = low[ltLen]
   endif
endif

// === BIAS ===
if biasSource = 1 then
   selectedHigh = lastSTHigh
   selectedLow  = lastSTLow
elsif biasSource = 2 then
   selectedHigh = lastMTHigh
   selectedLow  = lastMTLow
else
   selectedHigh = lastLTHigh
   selectedLow  = lastLTLow
endif

biasState = 0
if selectedHigh > 0 and selectedLow > 0 then
   if close > selectedHigh then
      biasState = 1
   elsif close < selectedLow then
      biasState = -1
   endif
endif

// === BAR COLOURING ===
if selectedHigh > 0 and selectedLow > 0 then
   if biasState = 1 then
      cR = bullR
      cG = bullG
      cB = bullB
   elsif biasState = -1 then
      cR = bearR
      cG = bearG
      cB = bearB
   else
      cR = neuR
      cG = neuG
      cB = neuB
   endif
   drawcandle(open, high, low, close) coloured(cR, cG, cB)
endif

return
