

KijunTrend indicator
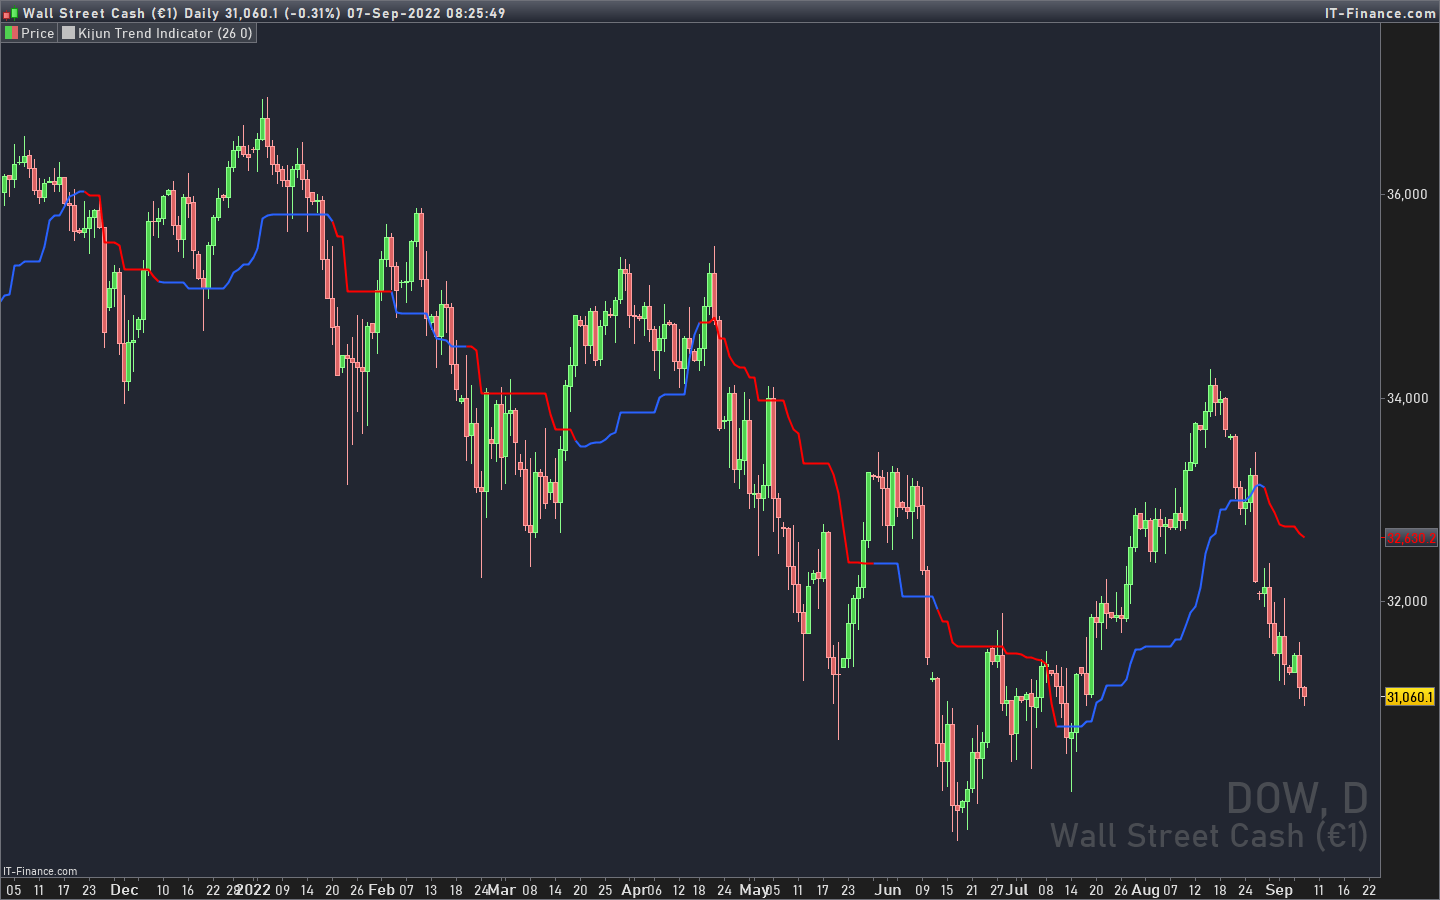
Suggested usage: In a trending market, to understand when it is good to enter short (red line) and when to enter long (blue line).
Technical Analysis: The original idea was taken from Larry Williams: an uptrend is identified when the price is above an 18-period simple moving average ( SMA ) and when at least two candles do not touch the simple moving average with their lows. The opposite is true for a downtrend.
Corrado Rondelli has therefore reinterpreted with Ichimoku aka “ichimokized” replacing the 18-period Simple Moving Average with the 26-period Kijun – as per the original Ichimoku settings.
In order to make the indicator more flexible an Exponential Moving Average ( EMA ) has also been added.
The indicator plots the chosen line that becomes red when it is good to enter short and blue when it is good to enter long.
Configuration:
– Length: period to be used to calculate the line.
– Type: the line type that can be the Kijun (26-period) or SMA / EMA (18-period)
(description from the original author: TheSocialCryptoClub)
//PRC_KijunTrend indicator | indicator
//07.09.2022
//Nicolas @ www.prorealcode.com
//Sharing ProRealTime knowledge
//converted from pinescript

// --- settings
mylineperiods = 26 //Length
mylinetype = 0 //0=Kijun, 1=SMA, 2=EMA
// --- end of settings

// default line is Kijun
if mylinetype=0 then
 myline = KijunSen[9,mylineperiods,52]
 // or SMA
elsif mylinetype=1 then
 myline = average[mylineperiods]
 // or EMA
else
 myline = average[mylineperiods,1]
endif

// filter conditions
long  =  low[1]>myline[1] and low[2]>myline[2] and low[3] <= myline[3]
short =  high[1]<myline[1] and high[2]<myline[2] and high[3]>= myline[3]

// color the line
if long then
 r=41
 g=98
 b=255
elsif short then
 r=255
 g=0
 b=0
endif

// plot
return myline coloured(r,g,b) style(line,2) as "Kijun Trend Indicator"