

Keltner Channel (EMA, ATR)
February 16, 2021, 10:23 AM
Indicators
0 Comments
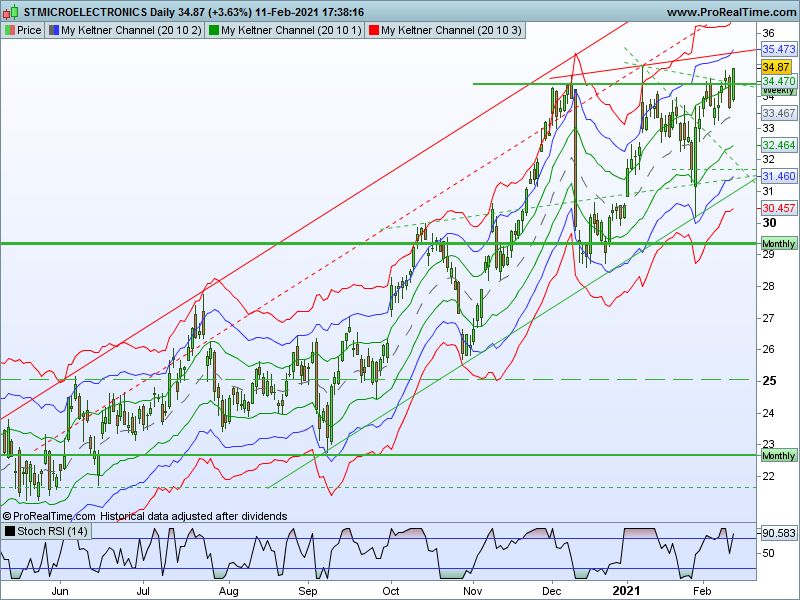
In his 1960 book, How to Make Money in Commodities, Chester Keltner introduced the “Ten-Day Moving Average Trading Rule,” which is credited as the original version of Keltner Channels.
This original version started with a 10-day SMA of the typical price {(H+L+C)/3)} as the centerline. The 10-day SMA of the High-Low range was added and subtracted to set the upper and lower channel lines. Linda Bradford Raschke introduced the newer version of Keltner Channels in the 1980s. Like Bollinger Bands, this new version used a volatility based indicator, Average True Range (ATR), to set channel width.
// Keltner Channel

//periodMA=20
//periodATR=10
//k=2

MA = ExponentialAverage[periodMA](close)
// Upper Keltner Band
UpperBand = MA + k*AverageTrueRange[periodATR](close)
// Lower Keltner Band
LowerBand = MA - k*AverageTrueRange[periodATR](close)
RETURN MA AS "Keltner MA" , UpperBand AS "Keltner Upper Band" , LowerBand as "Keltner Lower Band"
Download
Filename:
KeltnerChannel-EMA-ATR.itf
Downloads:
278

Master
Operating in the shadows, I hack problems one by one. My bio is currently encrypted by a complex algorithm. Decryption underway...
Author’s Profile
Loading...