

KDJ
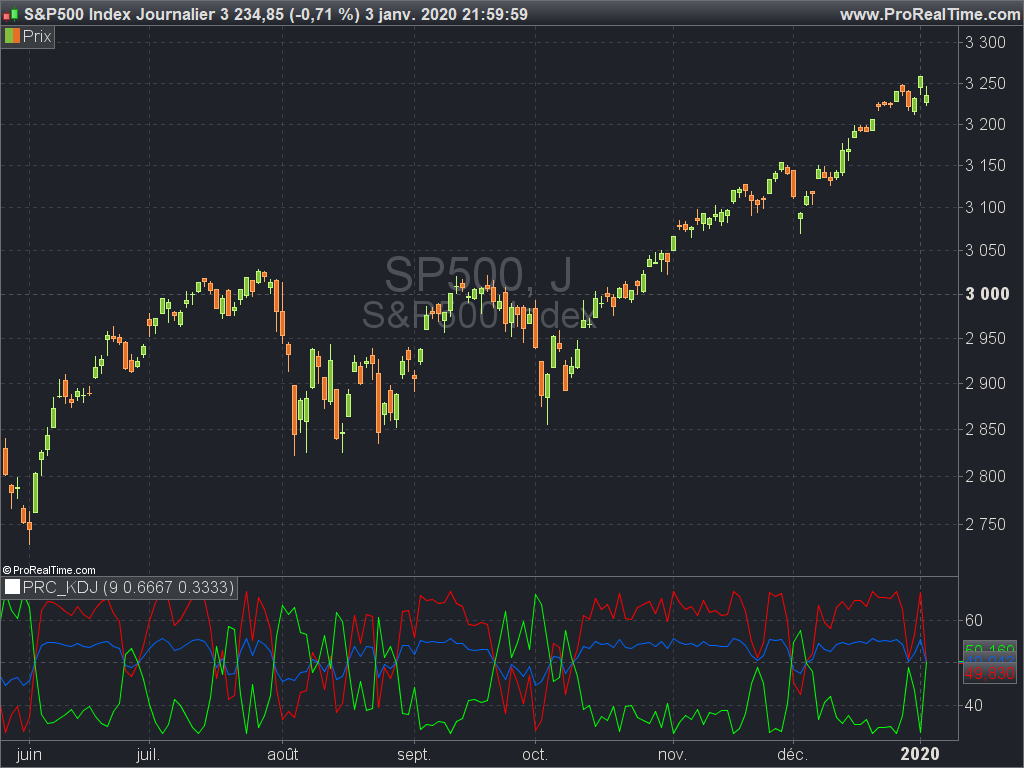
The KDJ indicator is derived from the Stochastic with the one difference being the addition of the J line. This implies that the KDJ indicator has a total of three lines; %K%D%J. The %J is simply put, the difference between the %K and the %D lines, which is similar to the MACD.
The difference between the %J and that of the MACD is that it is plotted as a histogram and the second being that the value are weighted and as such delivers more emphasis on the shorter term %K line.
What we now have is a line that moves quite slowly and has the knack to move beyond the range of a normal stochastic indicator.
This version is different from the one embedded in the platform and was translated from MT4 following a request in the forum.
//PRC_KDJ | indicator
//09.12.2019
//Nicolas @ www.prorealcode.com
//Sharing ProRealTime knowledge
//converted from MT4 code

// --- settings
nPeriod          = 9
factor1         = 0.6666666
factor2         = 0.3333333
// --- end of settings

Cn=close
Ln=close
Hn=close
for k=0 to nPeriod-1 do
if ln>low[k] then
ln=low[k]
endif
if hn<high[k] then
hn=high[k]
endif
next

if hn-ln <>0 then
rsv=(Cn-Ln)/(Hn-Ln)*100
else
RSV = 50
endif

percentK = factor1 * 50 + factor2 * RSV
percentD = factor1 * 50 + factor2 * percentK
percentJ = 3 * percentD - 2 * percentK

return percentk coloured(255,0,0), percentd coloured(0,100,255) , percentj coloured(0,255,0)