Kase Peak Oscillator – v2

v10.3
Kase Peak Oscillator – v2

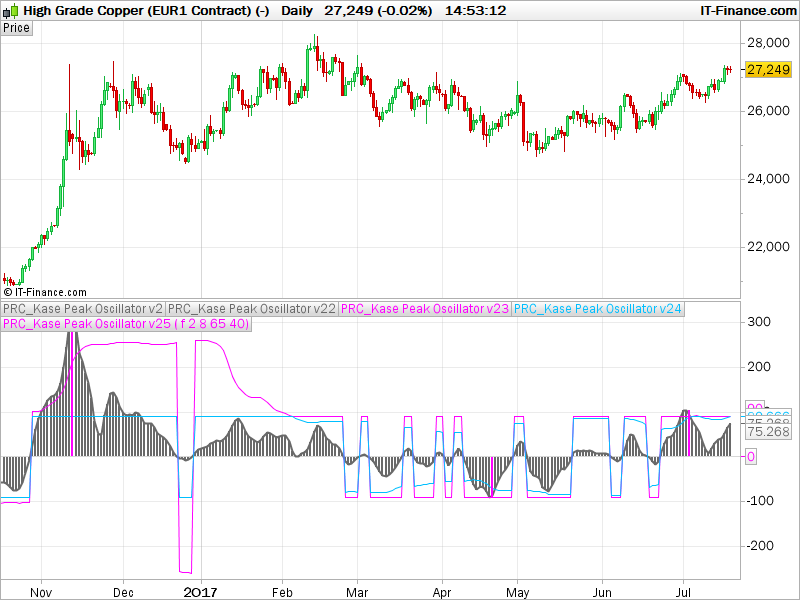
The Kase Peak Oscillator technical indicator was developed by Cynthia Kase.

The Kase Peak Oscillator indicator algorithm combines an Average True Range indicator and a Standard Deviation volatility indicator.

The logarithmic models used better reflect the true nature of the market and allow the indicator to automatically adapt to cycle time and volatility.

Second version of this indicator already in the library, but this time converted from a more advanced code translated from MT4 code, by a request in forums.


Share this

Risk disclosure:

No information on this site is investment advice or a solicitation to buy or sell any financial instrument. Past performance is not indicative of future results. Trading may expose you to risk of loss greater than your deposits and is only suitable for experienced investors who have sufficient financial means to bear such risk.

ProRealTime ITF files and other attachments : How to import ITF files into ProRealTime platform?

PRC is also on YouTube, subscribe to our channel for exclusive content and tutorials

  1. Toto le Heros • 07/22/2017 #

    Thanks Nicolas.
    This looks very interresting, despite I am not sure I fully understand it yet. (v23 and v24 not so clear for me. v25 is just to show peaks in pink if I understand well, so it could be valuable in the “allPeaksMode” on to highlight the “unfiltered” peaks (those which don’t appear in the “allPeaksMode” on) in a different color.
    Moreover, would it be possible to code as well the “little brother” : KaseCD. “KCD is the PeakOscillator minus its own average”.
    Many thanks and in advance again Nicolas.

    • Nicolas • 07/22/2017 #

      The KaseCD should also be coded, it is discussed in the Bard’s topic here: https://www.prorealcode.com/topic/kase-peak-oscillator-kase-cd-and-kase-permission/

  2. elanoa • 07/22/2017 #

    Salve sig. Nicolas…sono andato ad inserire l’indicatore nella piattaforma ma mi da Errore nella programmazione…………Errori di sintassi: Definisci la variabile kpolongcycle,kposhortcycle,kposensitivity,kpodeviations e allpeaksmode. Puo’ aiutarmi? Grazie.

    • Nicolas • 07/22/2017 #

      Please download the file or delete all // before these variables names.

  3. AlexF • 07/22/2017 #

    Hi, I can’t understand from the code why the histogram turns violet in certain points…

    • Nicolas • 07/22/2017 #

      Violet histogram is plotted with “kppBuffer” variable. Calculated between lines 51 to 66.

  4. ooples • 07/22/2017 #

    Can anyone explain this code to me?

    Log(Close[0]/Close[1]) Does Close[0] mean the current index and Close[1] means the previous index?

  5. Bard • 07/22/2017 #

    Kase Peak Out using Williams High Volatility Vix Fix Formula: (This finds market tops and bottoms based on Volatility)

    Kase PO William’s Vix Fix:
    (Add PRT Code not Working)

    //PRC_Kase Peak Oscillator V2 | indicator
    //19.07.2017
    //Nicolas @ http://www.prorealcode.com
    //Sharing ProRealTime knowledge
    //translated from MT4 code

    // — settings
    kpoDeviations= 2.0 // Kase peak oscillator deviations
    kpoShortCycle= 8 // Kase peak oscillator short cycle
    kpoLongCycle = 65 // Kase peak oscillator long cycle
    kpoSensitivity = 40
    allPeaksMode = 0 //1=true ; 0=false
    // — end of settings

    pd = 10

    if barindex>kpoLongCycle*2 then
    //ccLog = Log(Close[0]/Close[1])
    wvf = ((highest[pd](close)-low)/(highest[pd](close)))
    ccWVF = wvf
    ccDev = std[9](ccWVF)

    avg = average[30](ccDev)

    if (avg>0) then
    max1 = 0
    maxs = 0

    for k = kpoShortCycle to kpoLongCycle-1 do
    max1 = Max(Log(High[0]/Low[0+k])/Sqrt(k),max1)
    maxs = Max(Log(High[0+k]/Low[0])/Sqrt(k),maxs)
    next
    x1 = max1/avg
    xs = maxs/avg
    endif

    xp= kpoSensitivity*(average[3](x1)-average[3](xs))
    xpAbs = Abs(xp)

    kpoBuffer = xp
    kphBuffer = xp

    tmpVal = average[50](xpAbs)+kpoDeviations*std[50](xpAbs)
    maxVal = Max(90.0,tmpVal)
    minVal = Min(90.0,tmpVal)

    if (kpoBuffer > 0) then
    kpdBuffer = maxVal
    kpmBuffer = minVal
    else
    kpdBuffer = -maxVal
    kpmBuffer = -minVal
    endif
    kppbuffer=0
    if (not allPeaksMode) then
    if (kpoBuffer[1]>0 and kpoBuffer[1]>kpoBuffer[0] and kpoBuffer[1]>=kpoBuffer[2] and kpoBuffer[1]>= maxVal) then
    kppBuffer = kpoBuffer[1]
    endif
    if (kpoBuffer[1]<0 and kpoBuffer[1]<kpoBuffer[0] and kpoBuffer[1]<=kpoBuffer[2] and kpoBuffer[1]0 and kpoBuffer[1]>kpoBuffer[0] and kpoBuffer[1]>=kpoBuffer[2]) then
    kppBuffer = kpoBuffer[1]
    endif
    if (kpoBuffer[1]<0 and kpoBuffer[1]<kpoBuffer[0] and kpoBuffer[1]<=kpoBuffer[2]) then
    kppBuffer = kpoBuffer[1]
    endif
    endif
    endif

    return kphBuffer coloured(105,105,105) style(histogram), kpoBuffer coloured(105,105,105) style(line,2), kpdBuffer coloured(255,0,255), kpmBuffer coloured(0,191,255), kppBuffer coloured(255,0,255) style(histogram,2) as "kpp buffer"

    //105,105,105=grey
    //255,0,255=pink
    //0,191,255=blue

  6. Bard • 07/22/2017 #

    *Correction:

    if barindex>kpoLongCycle*2 then
    //ccLog = Log(Close[0]/Close[1])

    ccWVF = ((highest[pd](close)-low)/(highest[pd](close)))
    ccDev = std[9](ccWVF)

    Better colour scheme with Green Peak Outs to avoid confusion with KPO pink Peak Outs:

    return kphBuffer coloured(105,105,105) style(histogram), kpoBuffer coloured(105,105,105) style(line,2), kpdBuffer coloured(124,252,0), kpmBuffer coloured(0,191,255), kppBufferPO coloured(0,255,0) style(histogram,2) as “kpp buffer”

    //105,105,105=grey
    //255,0,255 =old pink Histogram PO
    //0,191,255 =blue
    //124,252,0 =green line
    //0,255,0 =green Histogram PO

avatar
Register or

Likes

avatar avatar avatar avatar avatar avatar avatar avatar avatar avatar avatar
Related users ' posts
Nicolas Please post any question on forums, thanks.
Lavallette Bonjour Nicolas. J'utilise la version 11 et moi aussi j'ai une ligne horizontale malgré l'a...
Nicolas il faut modifier la ligne 20 avec: if adaptive=1 and averagePeriod > 1 and barindex>(...
Nicolas
8 years ago
supertiti bonjour à tous J'utilise cet indicateur depuis plusieurs mois, une fois règlé "K" à sa conv...
Nicolas
8 years ago
GraHal Forked code I mention above is here ... GraHal wrote: So below is the PRC Stochastic RSI v...
GraHal Try again (quite limited what you can do as Comments in the Library) https://www.prorealco...
AutoFlanders Thanks GraHal, that's what i was looking for
Doctrading Nice Job ! Here is my version of the code :  KBO = 0 Tenkansen = (highest[9](high)+lowe...
gefinance Thanks for this code. The only thing left missing is the time lapse, otherwise, lots of old...
dakaodo Hi, Wilko. Acc to the original FRAMA paper by Ehlers, Ehler's own code only takes inputs for...
dakaodo For reference, here is Ehlers' original paper: http://www.mesasoftware.com/papers/FRAMA.p...
dakaodo Here is the code with only SC included, per ETFHQ. pri=customclose //len>=4, even on...
Nicolas Hi, there's no reason why it should not work on a 5 min chart. Just apply the indicator on y...
Percygreen77 good evening sorry for my english but the indicator don't work can you help me i have 10.3 v...
Nicolas By adding it on price, it should display the pattern detection on the price chart, and not ...
Nicolas
8 years ago
soulintact Thank you very much Nicolas for this great indicator. I have tried to apply it to a trading ...
laitus No funciona este indicador ¿¿?? ¿Alguien sabe por qué?
Nicolas
8 years ago
Better Volume
Better Volume
39
Indicators
Keyeming Hello Nicolas; not sure to undersntad line 167, and in the video I d'ont remember that the a...
Nicolas I don't know, this code is 6 years old and I made a 1:1 translation of the provided code by ...
Alai-n https://emini-watch.com/free-stuff/volume-indicator/
Nicolas
8 years ago
T3 Velocity
T3 Velocity
16
Indicators
tatankayotanka As you can do to set a marker directly in the price property page and then view it such as m...
Nicolas It may be a good idea to discuss this in the forum instead. Please open a new topic in probu...
Wester Hi, is this more or less the same as the TTM Squeeze indicator (john carter)
Nicolas I don't know really, just like you I found a lot of different formulas there and there on th...
CarlosFC  Thanks a lot Nicolas. I posted it. Carlos.
besho hello Nicolas how can i get this indicator i tried copy and paste the code but i didn't...
Guibourse Hi ! I am asking once again for your help : would it be possible to use the ATR as a "take p...
Tradingrob Many thanks for the indicator, however if the price is below the indicator, then the indicat...
aldtrading Merci pour ton travail ! J'ai de bons résultats en utilisant cet indicateur
Etienne Hi, I'm quite late in this thread. I'd just like to propose an enhancement because this in...
Nicolas Thanks Etienne.
Bard Hi Nicolas, I wanted to make this scaled indicator above between -1 and +1 instead of 0 to +...
Nicolas The code is correct, don't know if the label and color are the same as other trading softwar...
peppe novellino Hi Nicolas, the settings of the alligators are not editable. How can I change it? Thanks in ...
pabo_swe I got very bad performance with this script, it was slow... it seems like if one breaks out ...
juju333 Merci Nicolas, j'utilisais avec bonheur ce code dans la 10.3, il ne tourne plus dans la v11....
Nicolas Remplacer les lignes 11 et par 12 avec: yearlyHigh = Highest[max(1,BarIndex - lastYearBarI...
juju333 merci !!!
Madrosat Bonjour Nicolas Je souhaiterais faire colorier le fond du graphique supérieur en vert lorsq...
Nicolas Merci d'ouvrir un sujet dans le forum approprié.
Nwab Hello Mr Nicolas.. Please how can I set this up as an indicator to work on mt5. Your guidan...
Nicolas
9 years ago
Kuskus Starlight
Kuskus Starlight
5
Indicators
luigiR sara ovviamente mia premura condividerla nn appena sara pronta
Nicolas Why are posting your question here?! Its not related to this indicator...Please use the foru...
luigiR Hi Nicholas, excuse me, but I don't know about this opportunity, I try, sorry again
larouedegann best with this hour IF TIME =081000 THEN plushaut=highest[2](high) plusbas = lowest[2](lo...
CanAny1Trade Hi! I'm trying to put together a similar indicator but struggling. I want to mark the NY Pit...
jeanphi0034 Hello, I would like to use the QQE indicator which is based on smooth RSI as far as I unders...
ilstefano Bonjour Nicolas, te serait il possible de rajouter la fast ATR manquante dans le code? Merci
Nicolas Désolé je ne comprends pas la question ?

Top