







John Ehlers MAMA - The Mother of Adaptive Moving Average

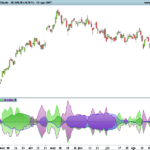
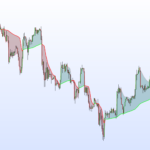
The MESA Adaptive Moving Average (MAMA) adapts to price movement in an entirely new and unique way. The adapation is based on the rate change of phase as measured by the Hilbert Transform Discriminator I have previously described. The advantage of this method of adaptation is that it features a fast attack average and a slow decay average so that composite average rapidly ratchets behind price changes and holds the average value until the next ratchet occurs.
An interesting set of indicators result if the MAMA is applied to the first MAMA line to produce a Following Adaptive Moving Average (FAMA). By using an alpha in FAMA that is half the value of the alpha in MAMA, the FAMA has steps in time synchronization with MAMA, but the vertical movement is not as great. As a result, MAMA and FAMA do not cross unless there has been a major change in market direction. This suggests an adaptive moving average crossover system that is virtually free of whipsaw trades.
(text and code adapted from jamesgoulding.com website).
//parameters :
// FastLimit = 0.5
// SlowLimit = 0.05

Price = (High+Low)/2

if(barindex>5) then
Smooth = (4*Price + 3*Price[1] + 2*Price[2] + Price[3]) / 10
Detrender = (.0962*Smooth + .5769*Smooth[2] - .5769*Smooth[4] - .0962*Smooth[6])*(.075*Period[1] + .54)

Q1 = (.0962*Detrender + .5769*Detrender[2] - .5769*Detrender[4] - .0962*Detrender[6])*(.075*Period[1] + .54)
I1 = Detrender[3]

jI = (.0962*I1 + .5769*I1[2] - .5769*I1[4] - .0962*I1[6])*(.075*Period[1] + .54)
jQ = (.0962*Q1 + .5769*Q1[2] - .5769*Q1[4] - .0962*Q1[6])*(.075*Period[1] + .54)

I2 = I1 - jQ
Q2 = Q1 + jI

I2 = .2*I2 + .8*I2[1]
Q2 = .2*Q2 + .8*Q2[1]

Re = I2*I2[1] + Q2*Q2[1]
Im = I2*Q2[1] - Q2*I2[1]
Re = .2*Re + .8*Re[1]
Im = .2*Im + .8*Im[1]
If Im <> 0 and Re <> 0 then
Period = 360/ATAN(Im/Re)
endif
If Period > 1.5*Period[1] then
Period = 1.5*Period[1]
endif
If Period < .67*Period[1] then
Period = .67*Period[1]
endif
If Period < 6 then
Period = 6
endif
If Period > 50 then
Period = 50
endif

Period = .2*Period + .8*Period[1]
SmoothPeriod = .33*Period + .67*SmoothPeriod[1]

if(I1<>0) then
Phase = ATAN(Q1 / I1)
endif

DeltaPhase = Phase[1] - Phase
If DeltaPhase < 1 then
DeltaPhase = 1
endif

alpha = FastLimit / DeltaPhase
If alpha < SlowLimit then
alpha = SlowLimit
endif

MAMA = alpha*Price + (1 - alpha)*MAMA[1]
FAMA = .5*alpha*MAMA + (1 - .5*alpha)*FAMA[1]

endif

RETURN MAMA as "MAMA", FAMA as "FAMA"
Comments
You must be logged in to post a comment.




Buongiorno Nicolas,
come faccio a trasformare questo interessantissimo indicatore in uno screener long/short?
Grazie,
Fabrizio


error displaying, code must end with RETURN. Any idea hot to fix it?