

John Ehler's Empirical Mode Decomposition
According to Wikipedia definition, the Empirical Mode Decomposition (EMD) is:
The empirical mode decomposition (EMD) method break down signals into various components, EMD can be compared with other analysis methods such as Fourier transform and Wavelet transform. Using the EMD method, any complicated data set can be decomposed into a finite and often small number of components. These components form a complete and nearly orthogonal basis for the original signal. In addition, they can be described as intrinsic mode functions (IMF).
Because the first IMF usually carries the most oscillating (high-frequency) components, it can be rejected to remove high-frequency components (e.g., random noise). EMD based smoothing algorithms have been widely used in seismic data processing, where high-quality seismic records are highly demanded.
Without leaving the time domain, EMD is adaptive and highly efficient.Since the decomposition is based on the local characteristic time scale of the data, it can be applied to nonlinear and nonstationary processes.
The indicator’s code is translated from the EasyLanguage version by a request on forum.
Ehler’s description of the method and indicator:
There just has to be a better way to determine whether the market is in a cycle mode or trend mode other than gazing at squiggly lines on your computer screen.
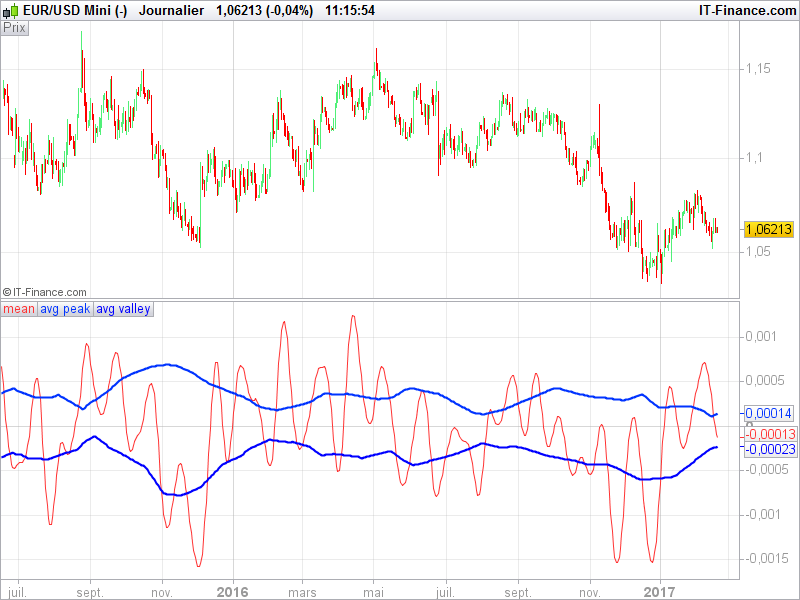
One approach is to compare the peak swings of the cycle mode to the amplitude of the trend mode.
We do this by capturing the peaks and averaging these peaks in a relatively long moving average. Correspondingly, one can capture the valleys and also average the valleys in a relatively long moving average. We then take a fraction of these averages as the thresholds between a trend mode and a cycle mode. If the trend is above the upper threshold the
market is in an uptrend. If the trend is below the lower threshold the market is in a downtrend. When the trend falls between the two threshold levels the market is in a cycle mode.
The setting of the fraction of the averaged peaks and valleys to be used to establish the thresholds is somewhat subjective and can be adjusted to fit your trading style. Personally, we prefer to trade in the cycle mode and therefore tend to set the thresholds relatively far apart.
In this way one can stop swing trading when the market is clearly in a trend.
//PRC_EmpiricalModeDecomposition | indicator
//20.02.2017
//Nicolas @ www.prorealcode.com
//Sharing ProRealTime knowledge
//converted from EasyLanguage code

//--- parameters
// Period=20
// delta=.1
// Fraction=.25
// ---

Price = medianprice

if barindex>Period then
 beta = Cos(360 / Period)
 gamma = 1 / Cos(720*delta / Period)
 alpha = gamma - SqRt(gamma*gamma - 1)
 BP = .5*(1 - alpha)*(Price - Price[2]) + beta*(1 + alpha)*BP[1] - alpha*BP[2]
 Mean = Average[Period*2](BP)
 Peak = Peak[1]
 Valley = Valley[1]
 If BP[1] > BP and BP[1] > BP[2] Then
  Peak = BP[1]
 endif
 If BP[1] < BP and BP[1] < BP[2] Then
  Valley = BP[1]
 endif
 AvgPeak = Average[50](Peak)
 AvgValley = Average[50](Valley)
endif

return Mean as "mean", Fraction*AvgPeak as "avg peak", Fraction*AvgValley as "avg valley"