

I Seek Trends - SuperTrend with Neutral Expansion Phase
I Seek Trends is a SuperTrend-style indicator that introduces a concept rarely seen in trend-following tools: a neutral expansion phase. While traditional SuperTrend indicators flip between bullish and bearish states, this indicator recognizes that markets often need time to establish a new direction after a trend ends. The neutral phase provides that buffer, reducing false signals during consolidation periods.
The name reflects the indicator’s purpose: it actively seeks confirmed trends rather than reacting impulsively to every price crossover.
The Problem with Traditional SuperTrend
The classic SuperTrend indicator, popularized by Olivier Seban, uses ATR-based bands that flip between support (in uptrends) and resistance (in downtrends). When price crosses the band, the indicator immediately switches direction.
This binary behavior creates a well-known problem: whipsaws during consolidation. When a trend ends and price enters a range, the SuperTrend flips back and forth, generating false signals. Traders either get stopped out repeatedly or learn to distrust the indicator during these periods.
I Seek Trends addresses this by introducing intermediate states that require confirmation before committing to a new trend direction.
The Five-State System
Unlike traditional two-state trend indicators, I Seek Trends operates with five distinct states:
- State 1 is Bullish. The indicator shows only the green support line, trailing upward using the tighter multUp multiplier. This is a confirmed uptrend where the indicator actively protects long positions.
- State -1 is Bearish. The indicator shows only the red resistance line, trailing downward using the tighter multDown multiplier. This is a confirmed downtrend where the indicator actively protects short positions.
- State 2 is Neutral from Bullish. This occurs when an uptrend breaks down. Both lines appear: the green support expands to the wider multSide multiplier while the red resistance appears with the tighter multDown multiplier. The indicator is waiting to see if this is a genuine reversal or just a pullback.
- State -2 is Neutral from Bearish. This occurs when a downtrend breaks up. Both lines appear: the red resistance expands to the wider multSide multiplier while the green support appears with the tighter multUp multiplier. The indicator is waiting for confirmation of the potential new uptrend.
- State 0 is Full Neutral. This occurs after a failed breakout from one of the neutral states. Both lines use the wide multSide multiplier. The market is considered directionless until a clear breakout occurs.
Transition Logic
The state transitions follow a logical flow that requires confirmation:
- From Bullish (state 1), if price breaks below the support line, the indicator moves to Neutral from Bullish (state 2) rather than immediately flipping bearish. This gives the market one bar to prove itself.
- From Neutral from Bullish (state 2), two outcomes are possible. If price continues lower and breaks the expanded support, the bearish trend is confirmed (state -1). If price reverses and breaks above the resistance, the breakout failed and we enter Full Neutral (state 0).
The same logic applies in reverse for bearish-to-bullish transitions through state -2.
- From Full Neutral (state 0), a clean breakout in either direction initiates the corresponding trend state directly.
The Lag Mechanism
A one-bar lag is built into the transition logic. When entering a neutral state, the indicator waits one bar before allowing further transitions. This prevents the indicator from rapidly cycling through states on volatile bars and ensures each state has time to be visually recognized by the trader.
Asymmetric Multipliers
The indicator uses three separate ATR multipliers, allowing asymmetric configuration:
- multUp controls the support distance during confirmed uptrends. A tighter value keeps the stop closer to price, protecting profits aggressively.
- multDown controls the resistance distance during confirmed downtrends. This can be set differently from multUp if you want different behavior for long versus short trades.
- multSide controls the band distance during neutral phases. A wider value gives the market more room to find direction without triggering premature state changes.
- This asymmetry is valuable because markets often behave differently in uptrends versus downtrends. Rallies tend to be slower and steadier while selloffs tend to be faster and more volatile. The three multipliers let you tune the indicator for these different characteristics.
Volatility Measure Options
The indicator offers two options for measuring volatility:
- When indicator is set to 0, the Average True Range (ATR) is used. This is the traditional choice for SuperTrend-style indicators and works well for most instruments.
- When indicator is set to 1, Standard Deviation is used instead. This can be useful for instruments where ATR may not capture volatility accurately, such as instruments with frequent gaps or those traded on exchanges with different session structures.
Price Smoothing
The priceLength parameter applies smoothing to the price used for band calculation. Instead of using raw close prices, the indicator uses a simple moving average of the close. This reduces noise in the band placement and can help prevent false breakouts caused by single-bar spikes.
Higher smoothing values create more stable bands but may lag significant price moves. Lower values keep the bands responsive but may generate more state transitions.
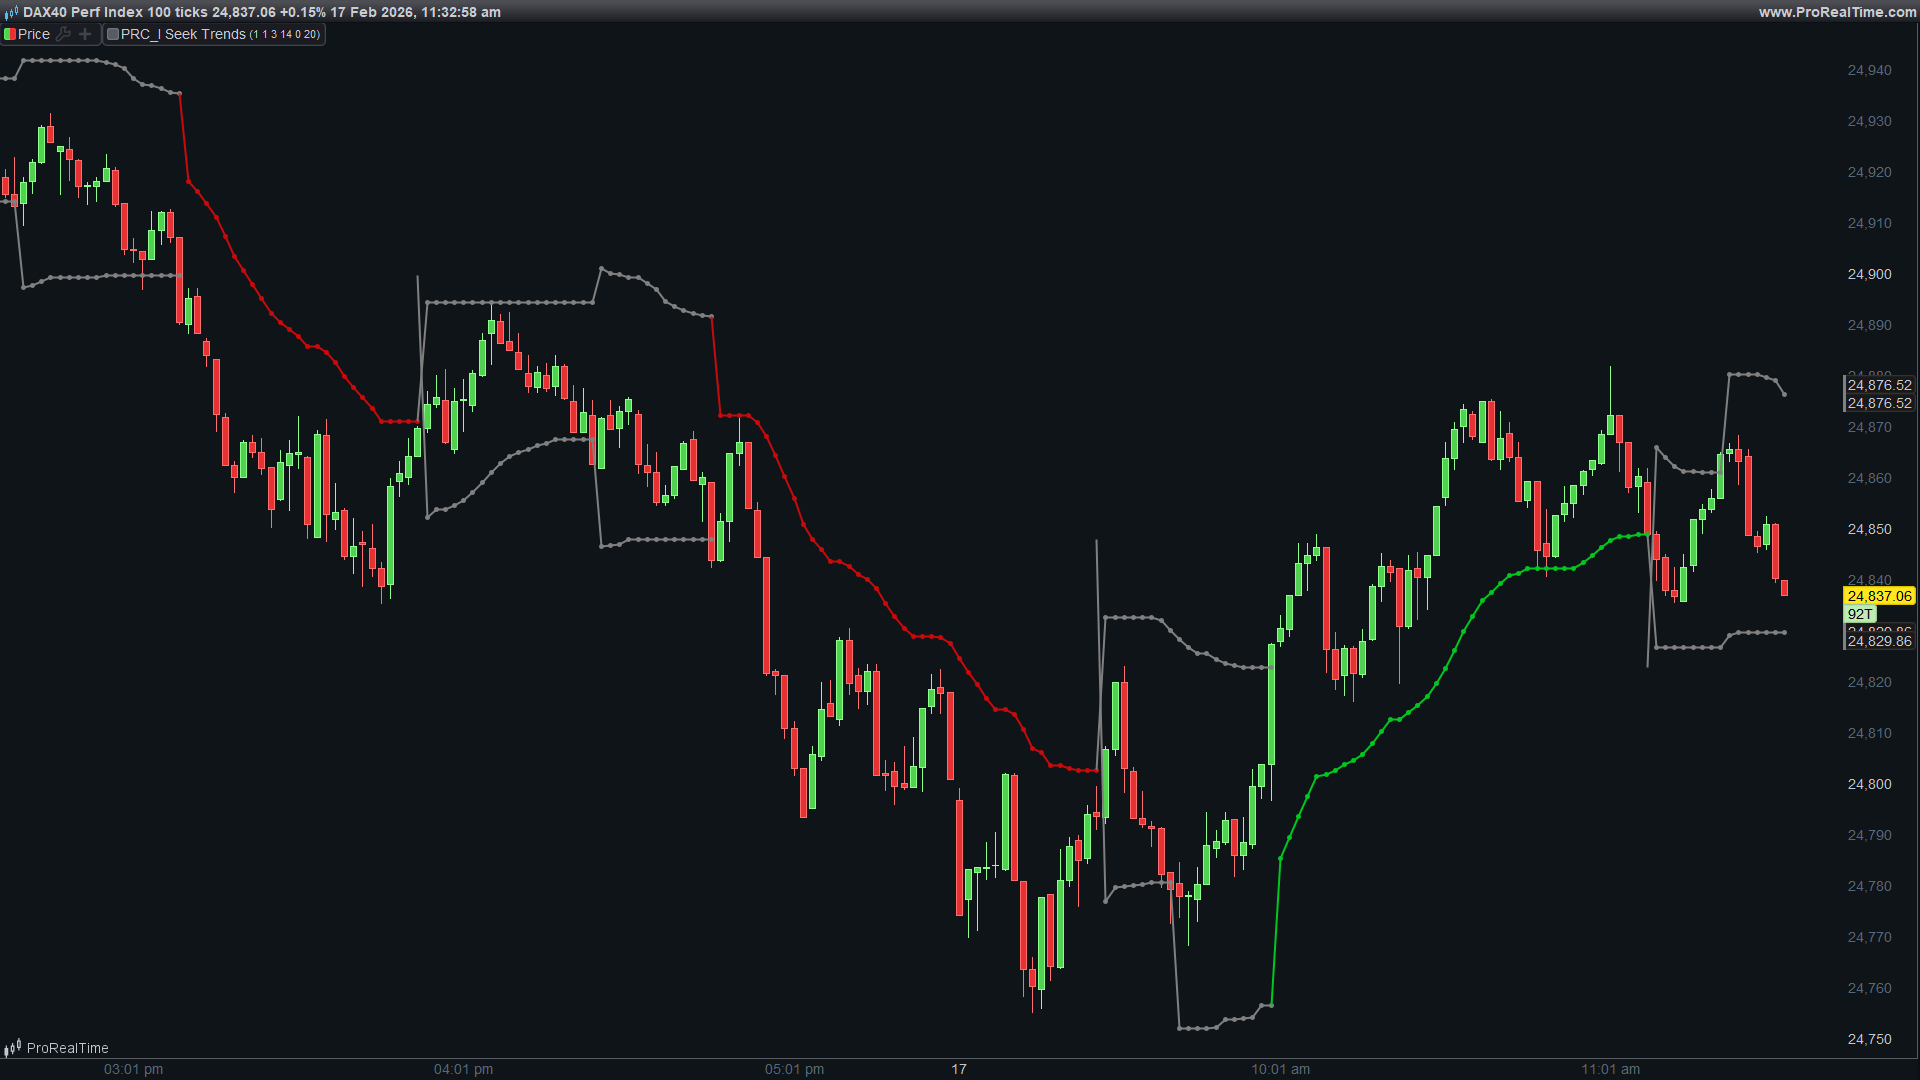
Visual Display
The indicator displays support and resistance as both dots and lines for clear visibility:
- During bullish states, only the green support line is visible, colored bright green.
- During bearish states, only the red resistance line is visible, colored bright red.
- During any neutral state (0, 2, or -2), both lines are visible and colored gray. This immediately signals to the trader that the market is in a transitional phase where trend-following signals should be treated with caution.
Parameters
- multUp is the ATR multiplier for support during uptrends. Default is 5.
- multDown is the ATR multiplier for resistance during downtrends. Default is 2.
- multSide is the ATR multiplier for bands during neutral phases. Default is 5.
- IndLength is the period for ATR or Standard Deviation calculation. Default is 14.
- indicator selects the volatility measure. Set to 0 for ATR, 1 for Standard Deviation.
- priceLength is the smoothing period applied to price. Default is 20.
// ============================================================================
// PRC_I Seek Trends
// 01/30/2026
// Nicolas @ www.prorealcode.com
// Coding & Trading with ProRealTime
// ============================================================================
// SuperTrend-style ATR trailing stop with neutral expansion phase
//
// STATES:
// 1 = Bullish (green dot only, multUp)
// -1 = Bearish (red dot only, multDown)
// 2 = Neutral from Bullish (green=multSide, red=multDown) - waiting confirmation
// -2 = Neutral from Bearish (green=multUp, red=multSide) - waiting confirmation
// 0 = Full Neutral (both sides multSide) - after failed breakout
//
// ============================================================================


// ---- Parameters
multUp = 5
multDown = 2
multSide = 5
IndLength = 14
indicator = 0
priceLength = 20
// ---------------------


// ATR
//IndLength = 14
if indicator = 0 then
   indic = AverageTrueRange[IndLength]
elsif indicator = 1 then
   indic = std[IndLength]
endif


IF BarIndex < IndLength+priceLength THEN
   state = 0
   supLine = average[priceLength,1](close)- indic * multSide
   resLine = average[priceLength,1](close) + indic * multSide
   neutralBar = 0
ELSE
   state = state[1]
   supLine = supLine[1]
   resLine = resLine[1]
   neutralBar = neutralBar[1]
ENDIF


IF state = 1 THEN
   // BULLISH: green dot trails up (multUp), no red dot
   newSup = average[priceLength,1](close)- indic * multUp
   supLine = MAX(supLine, newSup)

   // Break down -> Neutral from Bullish
   IF close < supLine THEN
      state = 2
      neutralBar = 1  // Start lag counter
      supLine = average[priceLength,1](close)- indic * multSide    // Green expands to multSide
      resLine = average[priceLength,1](close) + indic * multDown    // Red appears with multDown
   ENDIF

ELSIF state = -1 THEN
   // BEARISH: red dot trails down (multDown), no green dot
   newRes = average[priceLength,1](close) + indic * multDown
   resLine = MIN(resLine, newRes)

   // Break up -> Neutral from Bearish
   IF close > resLine THEN
      state = -2
      neutralBar = 1  // Start lag counter
      resLine = average[priceLength,1](close) + indic * multSide    // Red expands to multSide
      supLine = average[priceLength,1](close)- indic * multUp      // Green appears with multUp
   ENDIF

ELSIF state = 2 THEN
   // NEUTRAL FROM BULLISH: green=multSide (trailing), red=multDown (trailing)
   newSup = average[priceLength,1](close)- indic * multSide
   newRes = average[priceLength,1](close) + indic * multDown
   supLine = MAX(supLine, newSup)
   resLine = MIN(resLine, newRes)

   // Only allow transitions after lag period
   IF neutralBar = 0 THEN
      // Break down below green -> confirm Bearish
      IF close[1] < supLine[1] THEN
         state = -1
         resLine = average[priceLength,1](close) + indic * multDown
         // Break up above red -> Full Neutral (both multSide)
      ELSIF close[1] > resLine[1] THEN
         state = 0
         neutralBar = 1  // Reset lag for full neutral
         supLine = average[priceLength,1](close)- indic * multSide
         resLine = average[priceLength,1](close) + indic * multSide
      ENDIF
   ELSE
      neutralBar = 0  // Clear lag after 1 bar
   ENDIF

ELSIF state = -2 THEN
   // NEUTRAL FROM BEARISH: red=multSide (trailing), green=multUp (trailing)
   newSup = average[priceLength,1](close)- indic * multUp
   newRes = average[priceLength,1](close) + indic * multSide
   supLine = MAX(supLine, newSup)
   resLine = MIN(resLine, newRes)

   // Only allow transitions after lag period
   IF neutralBar = 0 THEN
      // Break up above red -> confirm Bullish
      IF close[1] > resLine[1] THEN
         state = 1
         supLine = average[priceLength,1](close)- indic * multUp
         // Break down below green -> Full Neutral (both multSide)
      ELSIF close[1] < supLine[1] THEN
         state = 0
         neutralBar = 1  // Reset lag for full neutral
         supLine = average[priceLength,1](close)- indic * multSide
         resLine = average[priceLength,1](close) + indic * multSide
      ENDIF
   ELSE
      neutralBar = 0  // Clear lag after 1 bar
   ENDIF

ELSIF state = 0 THEN
   // FULL NEUTRAL: both multSide, trailing both
   newSup = average[priceLength,1](close)- indic * multSide
   newRes = average[priceLength,1](close) + indic * multSide
   supLine = MAX(supLine, newSup)
   resLine = MIN(resLine, newRes)

   // Only allow transitions after lag period
   IF neutralBar = 0 THEN
      // Break up -> Bullish
      IF close[1] > resLine[1] THEN
         state = 1
         supLine = average[priceLength,1](close)- indic * multUp
         // Break down -> Bearish
      ELSIF close[1] < supLine[1] THEN
         state = -1
         resLine = average[priceLength,1](close) + indic * multDown
      ENDIF
   ELSE
      neutralBar = 0
   ENDIF
ENDIF


// Green dot visibility
IF state = 1 OR state = 2 OR state = -2 OR state = 0 THEN
   greenDot = supLine
   greenAlpha = 255
ELSE
   greenDot = supLine
   greenAlpha = 0
ENDIF


// Red dot visibility
IF state = -1 OR state = 2 OR state = -2 OR state = 0 THEN
   redDot = resLine
   redAlpha = 255
ELSE
   redDot = resLine
   redAlpha = 0
ENDIF


rr=10
rg=10
rb=10
gr=10
gg=10
gb=10


if state=1 then
   gr=0
   gg=200
   gb=30
elsif state=-1 then
   rr=200
   gg=0
   gb=30
elsif (state=0 or state=2 or state=-2)  then
   rr=128
   rg=128
   rb=128
   gr=128
   gg=128
   gb=128
endif


RETURN greenDot COLOURED(gr,gg,gb,greenAlpha) STYLE(point,2) AS "Support", redDot COLOURED(rr,rg,rb,redAlpha) STYLE(Point,2) AS "Resistance", greenDot COLOURED(gr,gg,gb,greenAlpha) STYLE(line,2) AS "Support", redDot COLOURED(rr,rg,rb,redAlpha) STYLE(line,2) AS "Resistance"
Trading Applications
For trend following, enter long positions when the indicator transitions to state 1 (confirmed bullish) and exit when it leaves state 1. The neutral phases keep you out of choppy markets where trend-following strategies typically underperform.
For position management, use the support and resistance levels as dynamic stop-loss placements. The asymmetric multipliers let you set tighter stops in one direction if your strategy has a directional bias.
For market regime identification, monitor what percentage of time the indicator spends in neutral states versus trending states. Instruments or timeframes with high neutral-state percentages may not be suitable for trend-following approaches.
For confirmation, combine the indicator with momentum oscillators or volume analysis. Enter only when both the trend state and your secondary indicator align.
Comparison to Standard SuperTrend
The key difference is patience. Standard SuperTrend reacts immediately to every crossover. I Seek Trends requires confirmation, accepting slightly later entries in exchange for fewer false signals.
In trending markets, both indicators perform similarly once the trend is established. The difference emerges at trend transitions where I Seek Trends filters out many of the whipsaws that plague the standard version.
The tradeoff is that genuine reversals will be signaled slightly later. The neutral phase confirmation requirement means you cannot catch the exact bottom or top. For most traders, this is an acceptable cost for improved signal quality.