

Hurst Cycle Channel Clone
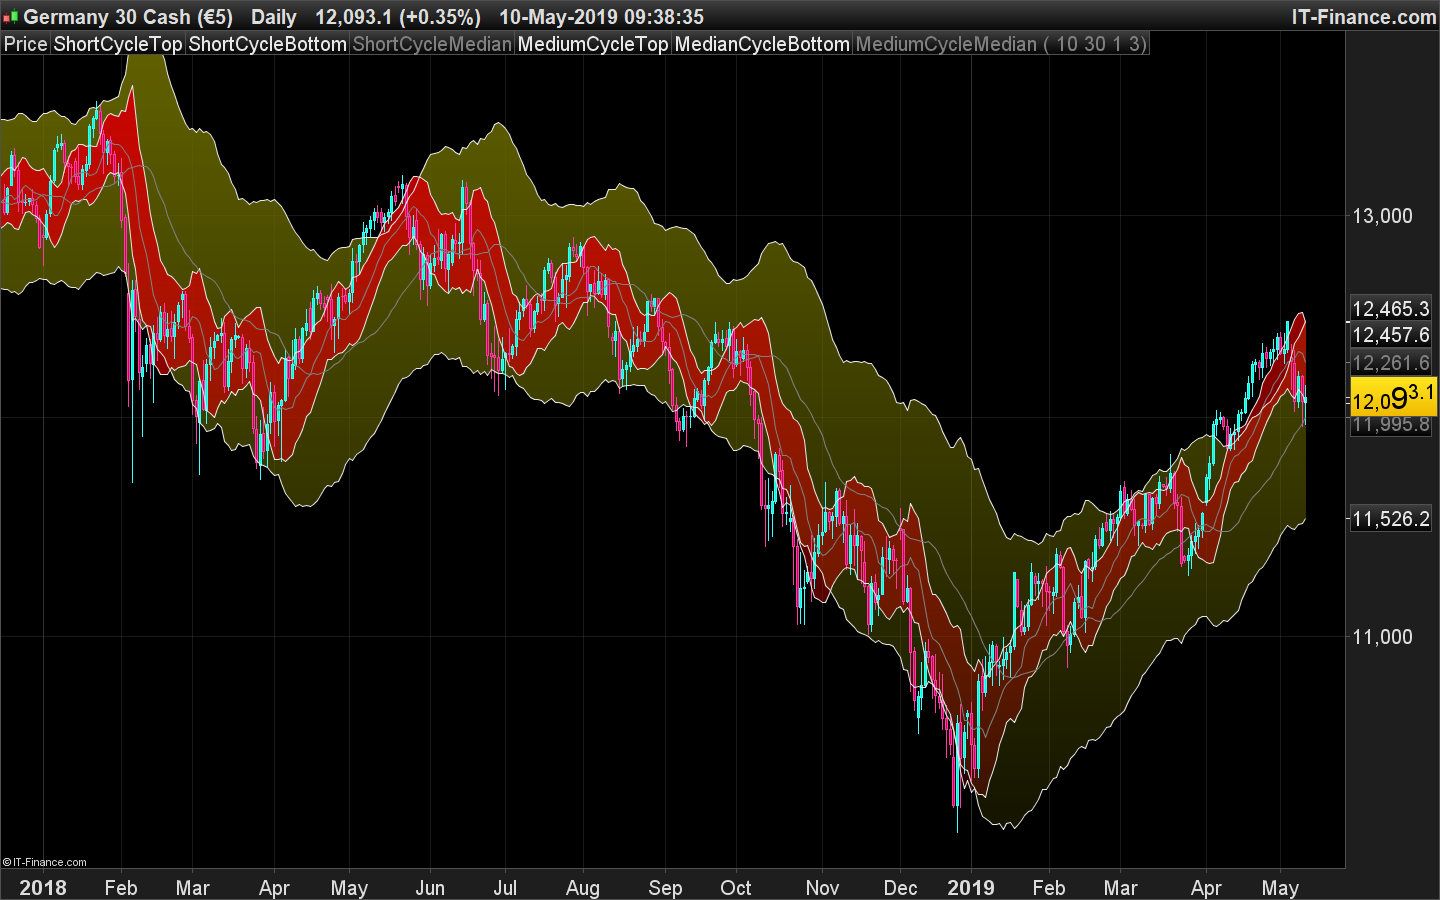
Cycle Channel is loosely based on Hurst’s nested channels. Basic idea is to identify and highlight the shorter cycles, in the context of higher degree cycles.
This indicator plots the shorter term (red) & medium term (green) cycles as channels. Some things to note:
As you can see the red channel keeps moving with in the bounds of green channel. When green breaches red channel, it usually signifies extreme market condition.
Both red & green channels provide support/resistance levels. Also, the green channel provides S/R levels to the inner red channel.
Movement of red channel with reference to green highlights reversal points, reducing momentum et al. For ex., point “(x)” in the chart shows how red channel failed to reach the upper green channel line and highlighted the local top.
(description from the original author LazyBear). Converted from pinescript by a request in the forum.
//PRC_Hurst Cycle Channel Clone | indicator
//10.05.2019
//Nicolas @ www.prorealcode.com
//Sharing ProRealTime knowledge
//converted from pinescript

// --- settings
sclt =  10 //Short Cycle Length
mclt =  30 //Medium Cycle Length
scm =  1.0 //Short Cycle Multiplier
mcm =  3.0 //Medium Cycle Multiplier
// --- end of settings

src=customclose //Source
once scl = round(sclt/2)
once mcl = round(mclt/2)

mascl=wilderaverage[scl](src)
mamcl=wilderaverage[mcl](src)
scmoff = scm*averagetruerange[scl]
mcmoff = mcm*averagetruerange[mcl]
once scl2=round(scl/2)
once mcl2=round(mcl/2)

sct =  mascl[scl2]+ scmoff
scb =  mascl[scl2]- scmoff
mct =  mamcl[mcl2]+ mcmoff
mcb =  mamcl[mcl2]- mcmoff

return sct coloured(232,232,232) as "ShortCycleTop", scb coloured(232,232,232) as "ShortCycleBottom", (sct+scb)/2 coloured(128,128,128) as "ShortCycleMedian", mct coloured(232,232,232) as "MediumCycleTop", mcb coloured(232,232,232) as "MedianCycleBottom", (mct+mcb)/2 coloured(128,128,128) as "MediumCycleMedian"