

HL-Trend
HL-Trend is a simple indicator that can be used for swing-trading on any timeframe.
Settings:
There are not settings to change, infact it is based on the graphic values of the price (high, low and close) .
How to use?
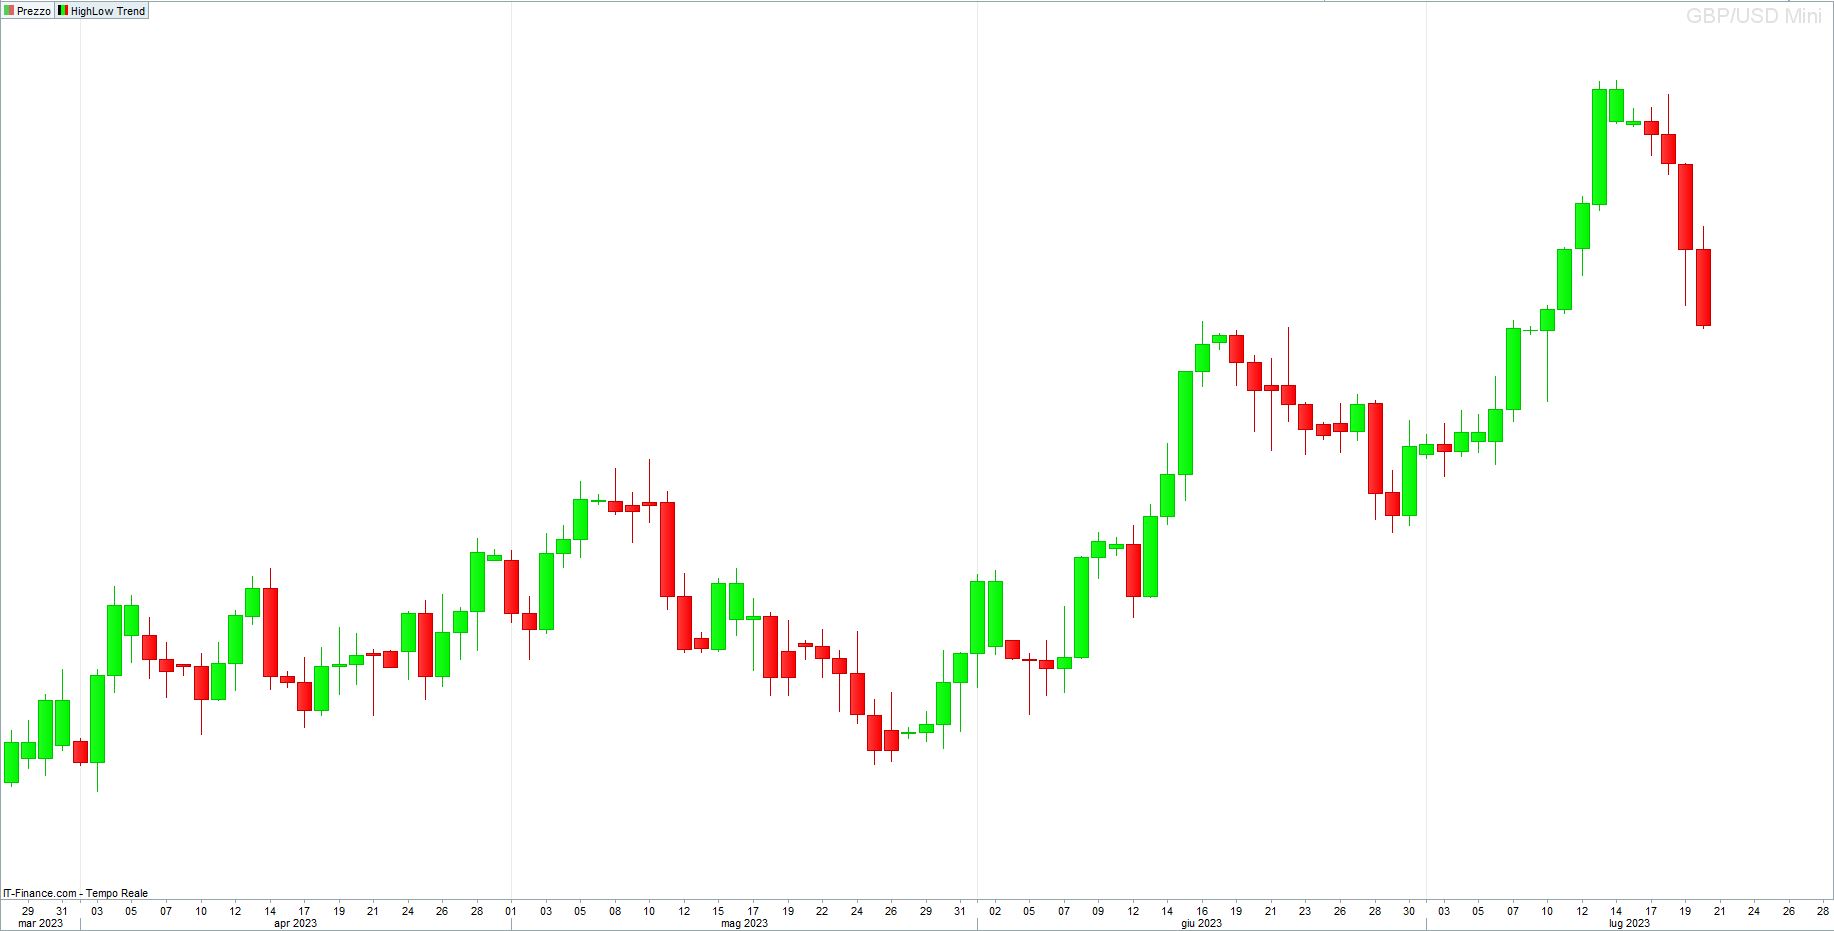
Signals are drawn on the chart: each green candle stands for bullish signal, and each red candle stands for bearish signal.
How does that work?
At the beginning the indicator calculates the ‘signal’ value. In fact, whenever the high of a candle is less than the maximum of the previous candle, the signal value shows that maximum, while every time the minimum of a candle is greater than the minimum of the previous candle, the signal value shows that minimum.
Finally, if close is greater than the previous signal value, the signal is positive and the candle is colored green, while if close is less than the previous signal value, the signal is negative and the candle is colored red.
It can be used in a swing strategy or like a filter before opening or closing a trade.
if high<high[1] then
signal=high
elsif low>low[1] then
signal=low
endif
if close>signal[1] then
a=0
b=255
c=0
elsif close<signal[1] then
a=255
b=0
c=0
endif
DRAWCANDLE(open, high, low, close) COLOURED(a,b,c)

return