

Highs, Lows and Higher Close, Lower Close Analysis
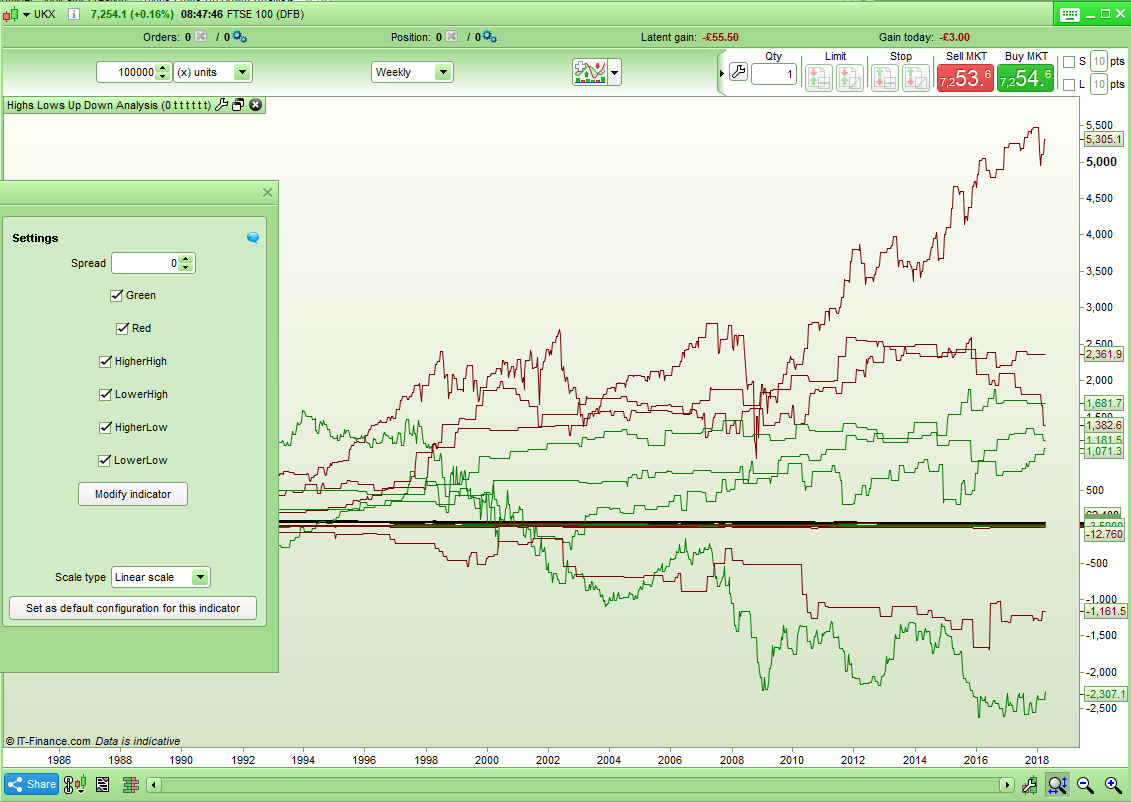
This analysis tool analyses each candle to see if it has a higher or lower high than the previous candle and whether it has a higher or lower low than the previous candle as well as whether the candle closed up or down. It then simulates what would have happened if you had bought at the close of the candle and held the position for just one candle and displays the results in a graph format.
This tool can help analyse market characteristics and improve our probability of entering the market at only the most favourable times.
This tool is better on longer time frame charts as there is too much noise on shorter time frame charts plus the one candle hold is too short a time period for sensible analysis on these types of charts.
You can select which criteria you want to display by selecting or deselecting it in the indicator window.
The eight possible combinations analysed are:
- Higher High and Higher Low (Upward trend) and Green Candle
- Higher High and Higher Low (Upward trend) and Red Candle
- Lower High and Lower Low (Downward trend) and Green Candle
- Lower High and Lower Low (Downward trend) and Red Candle
- Higher High and Lower Low (Engulfing) and Green Candle
- Higher High and Lower Low (Engulfing) and Red Candle
- Lower High and Higher Low (Inside Bar) and Green Candle
- Lower High and Higher Low (Inside Bar) and Red Candle
Hover over the chart to see the calculated results of the analysis.
Results calculated include:
Total return if you had opened one position each time the criteria had been met.
Percentage of successful bets.
Average Return (Total won/Number of bets)
Please download and import the .itf file to ensure that you get full functionality.
//Highs Lows Up Down Analysis
//Created by Vonasi
//18-4-2018

Win = Close > Open
Lose = Close < open
GreenBar = Close[1] > Open[1]
RedBar = Close[1] < Open[1]
HighUp = High[1] > High[2]
HighDown = High[1] < High[2]
LowUp = Low[1] > Low[2]
LowDown = Low[1] < Low[2]

//HighUp LowUp Green
IF HigherHigh and HigherLow and Green THEN
IF Win and HighUp and LowUp and GreenBar THEN//and close[1] > close[LookBack] THEN
HighUpLowUpG = HighUpLowUpG + 1
HighUpLowUpGCount = HighUpLowUpGCount +1
HighUpLowUpGTotal = HighUpLowUpGTotal + (close - open) - Spread
ENDIF
IF Lose and HighUp and LowUp and GreenBar THEN//and close[1] > close[LookBack] THEN
HighUpLowUpGCount = HighUpLowUpGCount +1
HighUpLowUpGTotal = HighUpLowUpGTotal - (open - close) - Spread
ENDIF
ENDIF

//HighUp LowUp Red
IF HigherHigh and HigherLow and Red THEN
IF Win and HighUp and LowUp and RedBar THEN//and close[1] > close[LookBack] THEN
HighUpLowUpR = HighUpLowUpR + 1
HighUpLowUpRCount = HighUpLowUpRCount +1
HighUpLowUpRTotal = HighUpLowUpRTotal + (close - open) - Spread
ENDIF
IF Lose and HighUp and LowUp and RedBar THEN//and close[1] > close[LookBack] THEN
HighUpLowUpRCount = HighUpLowUpRCount +1
HighUpLowUpRTotal = HighUpLowUpRTotal - (open - close) - Spread
ENDIF
ENDIF

//HighDown LowDownG Green
IF LowerHigh and LowerLow and Green THEN
IF Win and HighDown and LowDown and GreenBar THEN//and close[1] > close[LookBack] THEN
HighDownLowDownG = HighDownLowDownG + 1
HighDownLowDownGCount = HighDownLowDownGCount +1
HighDownLowDownGTotal = HighDownLowDownGTotal + (close - open) - Spread
ENDIF
IF Lose and HighDown and LowDown and GreenBar THEN//and close[1] > close[LookBack] THEN
HighDownLowDownGCount = HighDownLowDownGCount +1
HighDownLowDownGTotal = HighDownLowDownGTotal - (open - close) - Spread
ENDIF
ENDIF

//HighDown LowDownG Red
IF LowerHigh and LowerLow and Red THEN
IF Win and HighDown and LowDown and RedBar THEN//and close[1] > close[LookBack] THEN
HighDownLowDownR = HighDownLowDownR + 1
HighDownLowDownRCount = HighDownLowDownRCount +1
HighDownLowDownRTotal = HighDownLowDownRTotal + (close - open) - Spread
ENDIF
IF Lose and HighDown and LowDown and RedBar THEN//and close[1] > close[LookBack] THEN
HighDownLowDownRCount = HighDownLowDownRCount +1
HighDownLowDownRTotal = HighDownLowDownRTotal - (open - close) - Spread
ENDIF
ENDIF

//HighUp LowDown Green
IF HigherHigh and LowerLow and Green THEN
IF Win and HighUp and LowDown and GreenBar THEN//and close[1] > close[LookBack] THEN
HighUpLowDownG = HighUpLowDownG + 1
HighUpLowDownGCount = HighUpLowDownGCount +1
HighUpLowDownGTotal = HighUpLowDownGTotal + (close - open) - Spread
ENDIF
IF Lose and HighUp and LowDown and GreenBar THEN//and close[1] > close[LookBack] THEN
HighUpLowDownGCount = HighUpLowDownGCount +1
HighUpLowDownGTotal = HighUpLowDownGTotal - (open - close) - Spread
ENDIF
ENDIF

//HighUp LowDown Red
IF HigherHigh and LowerLow and Red THEN
IF Win and HighUp and LowDown and RedBar THEN//and close[1] > close[LookBack] THEN
HighUpLowDownR = HighUpLowDownR + 1
HighUpLowDownRCount = HighUpLowDownRCount +1
HighUpLowDownRTotal = HighUpLowDownRTotal + (close - open) - Spread
ENDIF
IF Lose and HighUp and LowDown and RedBar THEN//and close[1] > close[LookBack] THEN
HighUpLowDownRCount = HighUpLowDownRCount +1
HighUpLowDownRTotal = HighUpLowDownRTotal - (open - close) - Spread
ENDIF
ENDIF

//HighDown LowUp Green
IF LowerHigh and HigherLow and Green THEN
IF Win and HighDown and LowUp and GreenBar THEN//and close[1] > close[LookBack] THEN
HighDownLowUpG = HighDownLowUpG + 1
HighDownLowUpGCount = HighDownLowUpGCount +1
HighDownLowUpGTotal = HighDownLowUpGTotal + (close - open) - Spread
ENDIF
IF Lose and HighUp and LowDown and GreenBar THEN//and close[1] > close[LookBack] THEN
HighDownLowUpGCount = HighDownLowUpGCount +1
HighDownLowUpGTotal = HighDownLowUpGTotal - (open - close) - Spread
ENDIF
ENDIF

//HighDown LowUp Red
IF LowerHigh and HigherLow and Red THEN
IF Win and HighDown and LowUp and RedBar THEN//and close[1] > close[LookBack] THEN
HighDownLowUpR = HighDownLowUpR + 1
HighDownLowUpRCount = HighDownLowUpRCount +1
HighDownLowUpRTotal = HighDownLowUpRTotal + (close - open) - Spread
ENDIF
IF Lose and HighUp and LowDown and GreenBar THEN//and close[1] > close[LookBack] THEN
HighDownLowUpRCount = HighDownLowUpRCount +1
HighDownLowUpRTotal = HighDownLowUpRTotal - (open - close) - Spread
ENDIF
ENDIF

HighUpLowUpGPerc = (Round((HighUpLowUpG/HighUpLowUpGCount)*1000))/10
HighUpLowUpRPerc = (Round((HighUpLowUpR/HighUpLowUpRCount)*1000))/10
HighDownLowDownGPerc = (Round((HighDownLowDownG/HighDownLowDownGCount)*1000))/10
HighDownLowDownRPerc = (Round((HighDownLowDownR/HighDownLowDownRCount)*1000))/10
HighUpLowDownGPerc = (Round((HighUpLowDownG/HighUpLowDownGCount)*1000))/10
HighUpLowDownRPerc = (Round((HighUpLowDownR/HighUpLowDownRCount)*1000))/10
HighDownLowUpGPerc = (Round((HighDownLowUpG/HighDownLowUpGCount)*1000))/10
HighDownLowUpRPerc = (Round((HighDownLowUpR/HighDownLowUpRCount)*1000))/10

HighUpLowUpGAveRet = (Round((HighUpLowUpGTotal/HighUpLowUpGCount)*100))/100
HighUpLowUpRAveRet = (Round((HighUpLowUpRTotal/HighUpLowUpRCount)*100))/100
HighDownLowDownGAveRet = (Round((HighDownLowDownGTotal/HighDownLowDownGCount)*100))/100
HighDownLowDownRAveRet = (Round((HighDownLowDownRTotal/HighDownLowDownRCount)*100))/100
HighUpLowDownGAveRet = (Round((HighUpLowDownGTotal/HighUpLowDownGCount)*100))/100
HighUpLowDownRAveRet = (Round((HighUpLowDownRTotal/HighUpLowDownRCount)*100))/100
HighDownLowUpGAveRet = (Round((HighDownLowUpGTotal/HighDownLowUpGCount)*100))/100
HighDownLowUpRAveRet = (Round((HighDownLowUpRTotal/HighDownLowUpRCount)*100))/100

Return HighUpLowUpGPerc as "HighUpLowUpG%", HighUpLowUpRPerc as "HighUpLowUpR%",HighDownLowDownGPerc as "HighDownLowDownG%", HighDownLowDownRPerc as "HighDownLowDownR%", HighUpLowDownGPerc as "HighUpLowDownG%", HighUpLowDownRPerc as "HighUpLowDownR%", HighDownLowUpGPerc as "HighUpLowDownG%", HighDownLowUpRPerc as "HighDownLowUpR%", HighUpLowUpGTotal coloured(0,128,0) as "HighUpLowUpG Total", HighUpLowUpRTotal coloured(128,0,0) as "HighUpLowUpR Total", HighDownLowDownGTotal coloured(0,128,0) as "HighDownLowDownG Total", HighDownLowDownRTotal coloured(128,0,0) as "HighDownLowDownR Total", HighUpLowDownGTotal coloured(0,128,0) as "HighUpLowDownG Total", HighUpLowDownRTotal coloured(128,0,0) as "HighUpLowDownR Total", HighDownLowUpGTotal coloured(0,128,0) as "HighDownLowUpG Total", HighDownLowUpRTotal coloured(128,0,0) as "HighDownLowUpR Total", HighUpLowUpGAveRet coloured(0,128,0) as "HighUpLowUpG AveRet", HighUpLowUpRAveRet coloured(128,0,0) as "HighUpLowUpR AveRet", HighDownLowDownGAveRet coloured(0,128,0) as "HighDownLowDownG AveRet", HighDownLowDownRAveRet coloured(128,0,0) as "HighDownLowDownR AveRet", HighUpLowDownGAveRet coloured(0,128,0) as "HighUpLowDownG AveRet", HighUpLowDownRAveRet coloured(128,0,0) as "HighUpLowDownR AveRet", HighDownLowUpGAveRet coloured(0,128,0) as "HighDownLowUpG AveRet", HighDownLowUpRAveRet coloured(128,0,0) as "HighDownLowUpR AveRet"