

Gravity Trend Levels
Most trend envelopes wrap a moving average in a band of fixed width: a multiple of ATR, a percentage, a standard deviation. They look the same whether momentum is exploding or fading. Gravity Trend Levels, by BOSWaves, takes a different route. It measures the acceleration of the trend baseline, turns that acceleration into a decaying “gravity” score, and lets that score drive both the band width and the thickness of a one sided cloud. The result is an overlay that visibly tightens when momentum is strong and loosens as the move runs out of fuel, before any flip occurs.
It gives you three things in one tool: a latching trend regime (like a Supertrend), a real time momentum gauge (the cloud thickness), and a set of structural memory levels (the fail lines printed where each previous trend collapsed).
Theory Behind the Indicator
Baseline and a custom volatility unit
The baseline is an EMA of the close. Instead of ATR, the indicator measures volatility as the Mean Absolute Deviation (MAD) of price around that baseline: the average absolute distance between close and EMA over a lookback. MAD becomes the unit that both normalises acceleration and scales every band and cloud distance, so the whole construction stays in one consistent measure.
baseline = EMA(close, trendLen)
MAD      = average( abs(close - baseline), madLen )
The gravity engine (the distinctive part)
This is where the indicator earns its name. It does not look at price position, it looks at how fast the trend is bending:
velocity     = baseline - baseline[gravityLookback]   ' rate of change of the trend
acceleration = velocity - velocity[1]                 ' is the trend speeding up or stalling
normAccel    = acceleration / MAD                      ' volatility normalised
The acceleration reading is converted into a single scalar, gravity:
- When normalised acceleration clears a small threshold, gravity is set proportional to that acceleration and capped at a maximum (a fresh push of force).
- When acceleration falls back below the threshold, gravity does not reset to zero. It decays exponentially, multiplied by a decay factor each bar, exactly like a physical force losing its grip.
Gravity is then squashed into a normalised 0 to 1 value called pull. High pull means an active, accelerating trend. Pull fading toward zero means the move is coasting.
Adaptive bands and the one sided cloud
Pull drives two adaptive behaviours:
- Band width. The band multiplier interpolates between a wide setting at zero pull and a tight setting at full pull. Strong gravity pulls the bands in close to price, weak gravity lets them widen.
- Cloud thickness. A one sided cloud sits below price in an uptrend and above price in a downtrend. Its thickness scales with pull, so a thick cloud signals strong conviction and a thinning cloud is an early warning that gravity is decaying.
The trend itself is a latching state machine, the same logic a Supertrend uses: a close beyond the upper band sets a bullish state, a close beyond the lower band sets a bearish state, and the state holds until the opposite band is breached. Noise inside the bands does not flip it.
Fail levels and retest diamonds
Two more layers add structure:
- Gravity fail levels. On every flip, a horizontal line is projected from the extreme of the flip bar (the low on a bullish flip, the high on a bearish flip). It marks the exact price where the previous directional force collapsed, and it stays on the chart as a structural reference for future support or resistance.
- Retest diamonds. Once a trend is established (after a configurable buffer of bars), every time price returns to touch the inner edge of the cloud a small diamond is printed, with a cooldown so they do not cluster. These mark lower risk continuation points inside the trend, not new signals.
How to Read the Indicator
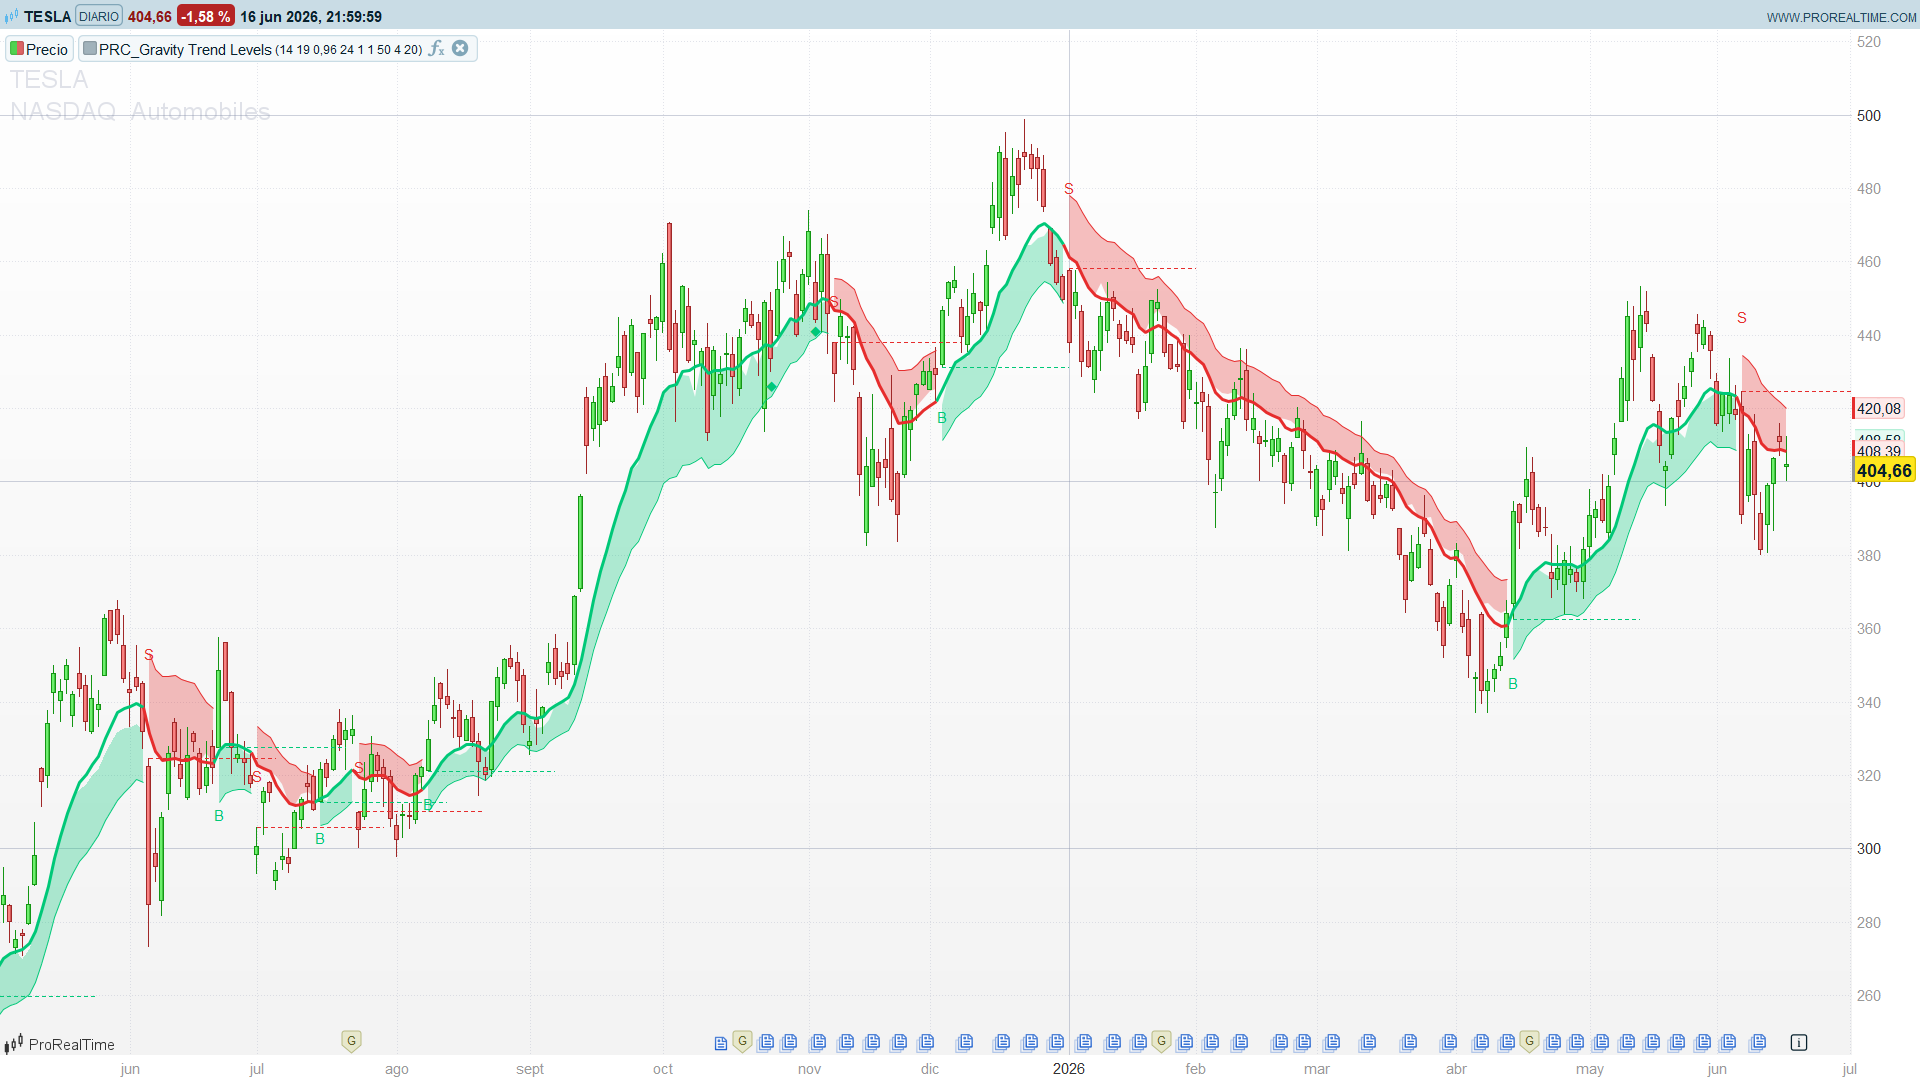
- Regime first. A green baseline with the cloud below price means bullish, a red baseline with the cloud above price means bearish. The state only flips on a decisive close beyond the opposite band.
- Read the cloud thickness as a fuel gauge. Thick cloud, strong active pull, trust the trend. Thinning cloud, gravity is decaying, tighten risk and expect a possible flip.
- B and S labels are the flips. They print on the bar where the regime changed and the new fail level is projected.
- Fail levels are structural memory. Watch how price behaves when it later returns to a prior fail line: respect confirms structure, a clean break is meaningful.
- Diamonds are continuation re entries. A diamond inside an established trend flags a pullback to the inner cloud edge, a lower risk way to join the move than chasing the original flip.
Practical Applications
- Trend filter with a built in momentum read. Allow longs only while bullish and shorts only while bearish, but use the cloud thickness to size conviction rather than treating every trend bar equally.
- Flip entries with a ready made invalidation. Enter on the flip, place the stop at the projected fail level, which is the price where the prior force already failed.
- Pullback continuation. Wait for a retest diamond in the trend direction and join on the reclaim, instead of entering at the extended flip bar.
- Early exit on decay. A cloud that thins steadily during an extended trend is a warning to take profit or tighten stops ahead of the formal flip.
- Multi timeframe alignment. Use the higher timeframe gravity state as a directional bias and take lower timeframe flips or diamonds only in that direction.
Indicator Configuration
The defaults follow the author suggested baseline configuration:
trendLen= 14: EMA period of the baseline.gravityLookback= 19: window for the velocity (rate of change) measurement.gravityDecay= 0.96: how slowly gravity fades between acceleration events. Higher (toward 0.99) sustains pull longer, lower (toward 0.80) lets it fade fast.madLen= 24: lookback for the MAD volatility unit.trailMin= 1.0 andtrailMax= 1.0: tight and wide band multipliers. With both equal the outer band width is constant, while the cloud still breathes through its pull scaled thickness. SettrailMinbelowtrailMaxto make the outer band adapt as well.signalBuffer= 50: bars after a flip before retest diamonds are allowed.retestCooldown= 4: minimum spacing between consecutive diamonds.failExtension= 20: how far each fail level line projects forward from the flip bar.
Code
//--------------------------------------------------------//
//PRC_Gravity Trend Levels [BOSWaves]
//version = 0
//16.06.26
//Iván González @ www.prorealcode.com
//Sharing ProRealTime knowledge
//--------------------------------------------------------//
//-----Inputs---------------------------------------------//
trendLen = 14
gravityLookback = 19
gravityDecay = 0.96
madLen = 24
trailMin = 1.0
trailMax = 1.0
signalBuffer = 50
retestCooldown = 4
failExtension = 20
//--------------------------------------------------------//
//-----Baseline + MAD volatility--------------------------//
baseline = average[trendLen, 1](close)
madVal = max(average[madLen](abs(close - baseline)), 0.000001)
//--------------------------------------------------------//
//-----Velocity / acceleration / gravity state-----------//
velocity = baseline - baseline[gravityLookback]
acceleration = velocity - velocity[1]
normAccel = acceleration / madVal

warmup = max(trendLen + gravityLookback + 2, madLen)

if barindex <= warmup then
   gravity = 0
elsif abs(normAccel) > 0.1 then
   gravity = min(abs(normAccel) * 8, 2.0)
else
   gravity = gravity * gravityDecay
endif

pull = min(gravity / 1.5, 1.0)
//--------------------------------------------------------//
//-----Adaptive trail + bands-----------------------------//
trailMult = trailMax + (trailMin - trailMax) * pull
upperBand = baseline + madVal * trailMult
lowerBand = baseline - madVal * trailMult
//--------------------------------------------------------//
//-----Trend state machine (warmup-guarded)---------------//
if barindex <= warmup then
   trendState = 0
elsif close crosses over upperBand then
   trendState = 1
elsif close crosses under lowerBand then
   trendState = -1
else
   trendState = trendState[1]
endif

flipBull = trendState = 1 and trendState[1] = -1
flipBear = trendState = -1 and trendState[1] = 1
//--------------------------------------------------------//
//-----Gravity cloud (one-sided, pull-scaled)-------------//
thickness = madVal * (0.30 + 0.70 * pull)

if trendState = 1 then
   upOuter = lowerBand
   upInner = lowerBand + thickness
   dnOuter = undefined
   dnInner = undefined
   cloudInnerVal = upInner
   r = 0
   g = 200
   b = 120
   alphaup = 255
   alphadn = 0
elsif trendState = -1 then
   upOuter = undefined
   upInner = undefined
   dnOuter = upperBand
   dnInner = upperBand - thickness
   cloudInnerVal = dnInner
   r = 230
   g = 45
   b = 45
   alphaup = 0
   alphadn = 255
else
   upOuter = undefined
   upInner = undefined
   dnOuter = undefined
   dnInner = undefined
   cloudInnerVal = undefined
   r = 150
   g = 150
   b = 150
   alphaup = 0
   alphadn = 0
endif

//--------------------------------------------------------//
//-----Retest counters + detection------------------------//
if flipBull or flipBear then
   barsSinceFlip = 0
elsif barindex <= warmup then
   barsSinceFlip = 9999
else
   barsSinceFlip = barsSinceFlip + 1
endif

if barindex <= warmup then
   barsSinceDiamond = 9999
else
   barsSinceDiamond = barsSinceDiamond + 1
endif

retestBull = trendState = 1 and close <= cloudInnerVal and barsSinceFlip > signalBuffer and barsSinceDiamond > retestCooldown
retestBear = trendState = -1 and close >= cloudInnerVal and barsSinceFlip > signalBuffer and barsSinceDiamond > retestCooldown

if retestBull or retestBear then
   barsSinceDiamond = 0
endif
//--------------------------------------------------------//
//-----Drawings: fail levels, flip signals, diamonds------//
if flipBull then
   drawsegment(barindex , low, barindex + failExtension, low) coloured(0, 200, 120) style(dottedline)
   drawtext("B", barindex, low - thickness - madVal * 0.3) coloured(0, 200, 120)
endif

if flipBear then
   drawsegment(barindex , high, barindex + failExtension, high) coloured(230, 45, 45) style(dottedline)
   drawtext("S", barindex, high + thickness + madVal * 0.3) coloured(230, 45, 45)
endif

if retestBull then
   drawtext("◆", barindex, low - madVal * 0.3) coloured(0, 200, 120)
endif

if retestBear then
   drawtext("◆", barindex, high + madVal * 0.3) coloured(230, 45, 45)
endif

if trendState <> trendState[1] then
   alphaup=0
   alphadn=0
elsif trendState=1 then
   alphaup=255
   alphadn=0
elsif trendState=-1 then
   alphaup=0
   alphadn=255
else
   alphaup=0
   alphadn=0
endif
colorbetween(upOuter, upInner, 0, 200, 120, alphaup*0.3)
colorbetween(dnOuter, dnInner, 230, 45, 45, alphadn*0.3)
//--------------------------------------------------------//
RETURN baseline COLOURED(r, g, b) STYLE(line, 3) AS "Baseline",       upOuter COLOURED(0, 200, 120,alphaup) STYLE(line, 1) AS "Cloud Up", dnOuter COLOURED(230, 45, 45,alphadn) STYLE(line, 1) AS "Cloud Dn"
