

Gartley Pattern Indicator (222) for ProRealTime
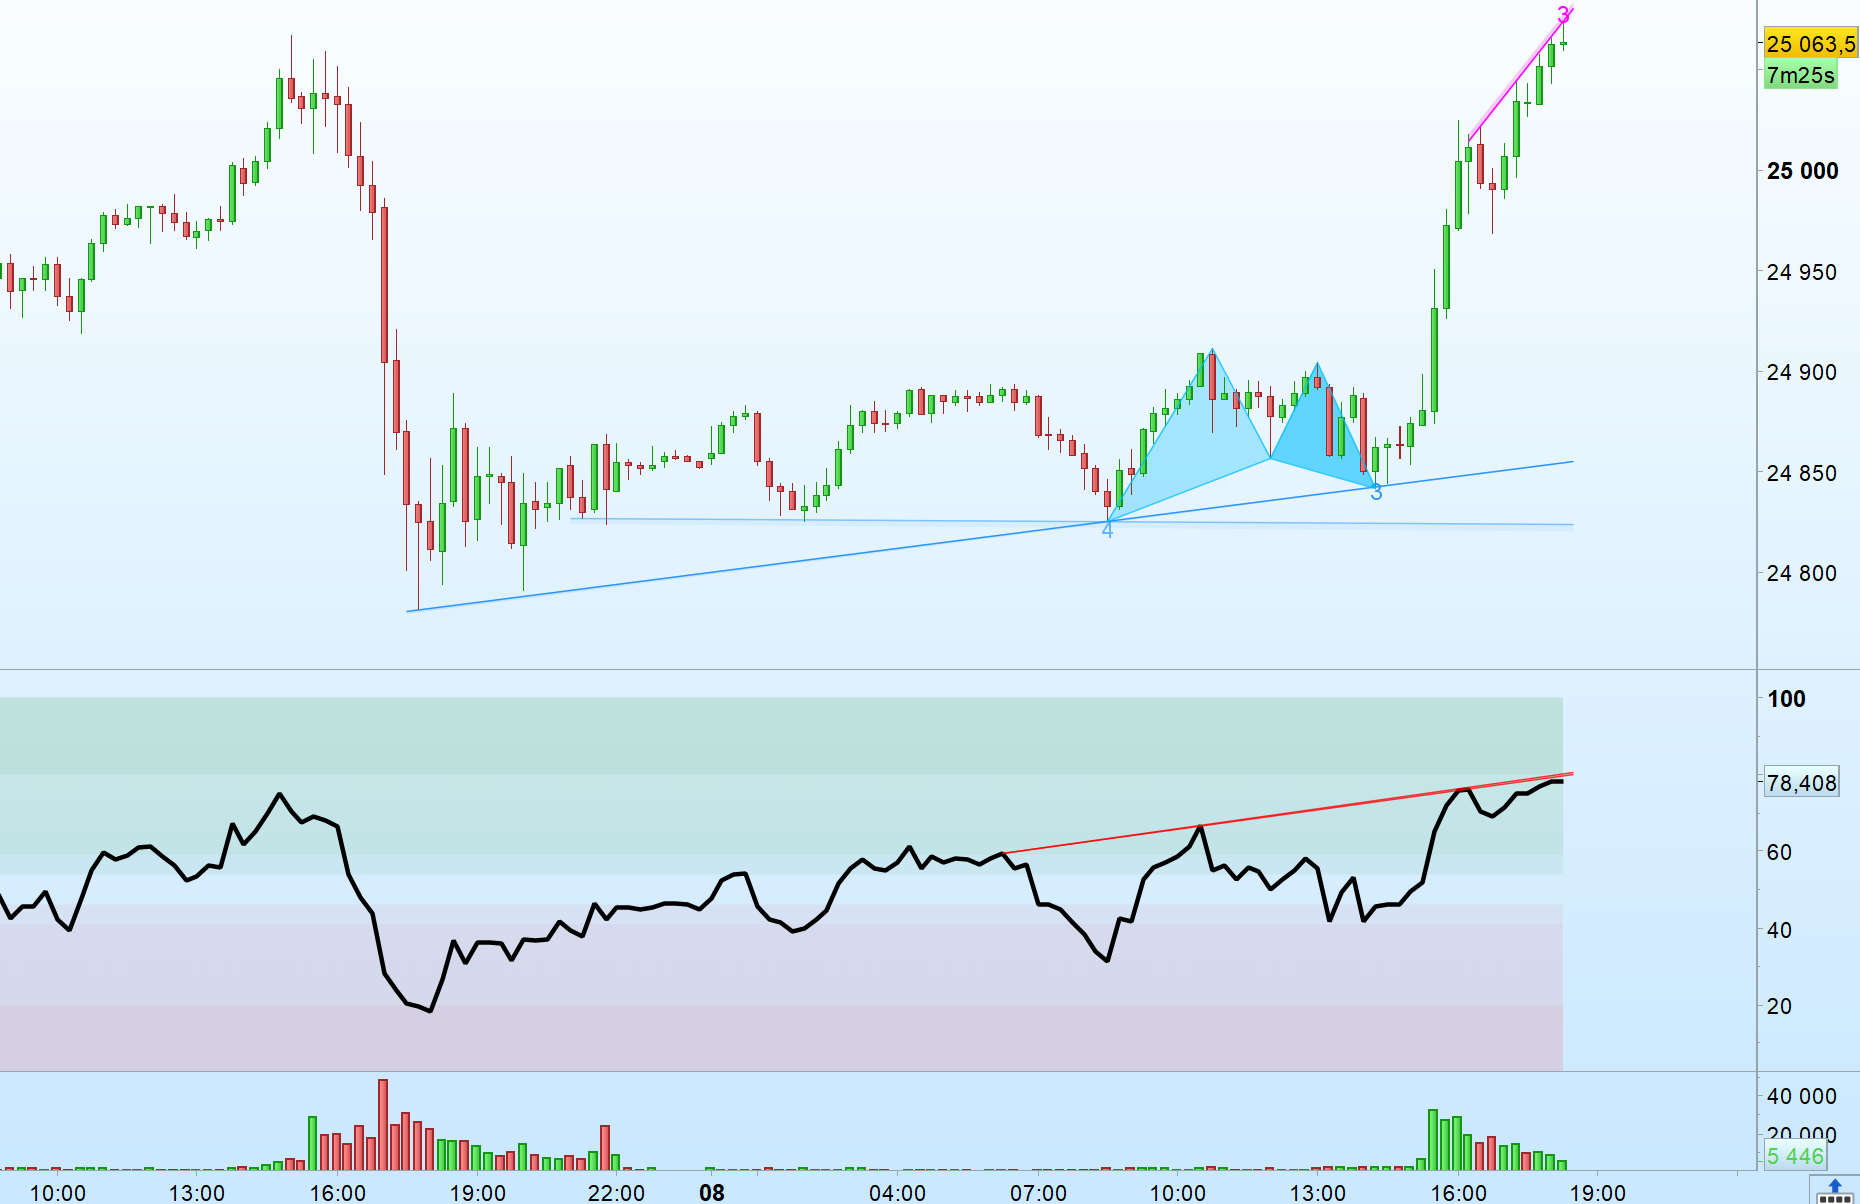
This ProRealTime indicator scans price action using a multi-length zigzag-style turning point detection and attempts to identify Gartley (“222”) harmonic patterns in both bullish and bearish forms. When a valid structure is found, it draws two triangles on the chart to visually highlight the X-A-B and B-C-D legs.
Note: The script uses proportional (Fibonacci) constraints with an adjustable tolerance (“marge”). Pattern recognition is sensitive to market noise and the turning-point window length; always validate visually and in context (trend, support/resistance, volatility).
Description
The indicator operates in two main stages:
- Turning point detection (zigzag-like): For several window lengths (wl), it detects local highs/lows by checking whether a past bar (offset wl) is the highest/lowest over a symmetric range (2*wl+1). It stores the last three highs and lows indices to build swing structures.
- Gartley pattern validation: Using the stored swing points, it tests bullish and bearish Gartley geometries by measuring the legs (XA, AB, BC, CD) and comparing them to typical Fibonacci ratios (e.g., AB ~ 0.618 of XA, D near 0.786 of XA), within a tolerance. When the current bar qualifies as point D, the script draws colored triangles to display the pattern.
Bullish patterns are drawn in deepskyblue; bearish patterns are drawn in red. The script also includes checks to ensure point X is an extreme (lowest/ highest) over the relevant segment and that point D is the current extreme.
Configuration
- marge (default 0.2): Error tolerance applied to Fibonacci ratio checks. The comment indicates a percentage tolerance; increasing this value will generally detect more patterns (with a higher risk of false positives), while decreasing it will be stricter.
- init (default 1): Internal initialization flag used to reset arrays on first run. Typically not changed by users.
- Turning point window range (hard-coded): The zigzag detection loop runs from wl = 5 to 21. Larger wl values generally mean fewer, more significant swing points; smaller values mean more frequent swings.
- Pattern detection window range (hard-coded): The Gartley detection loop runs from wl = 2 to 56, allowing the script to evaluate multiple swing scales.
Practical tip: If you want fewer signals, consider narrowing the wl ranges and/or reducing marge. If you want more signals, widen the wl ranges and/or increase marge.
//—Initialisation

Once init = 1
Once marge = 0.2 // 2% de marge d’erreur

If init = 1 then
For wl = 0 to 30 do
$Newlow[wl] = 0
$Newhigh[wl] = 0
$LastTurningPoint[wl] = 0
$Top1x[wl] = 0
$Top2x[wl] = 0
$Top3x[wl] = 0
$Bot1x[wl] = 0
$Bot2x[wl] = 0
$Bot3x[wl] = 0
Next
init = 0
Endif

//—Zigzag points detection

For wl = 5 to 21 do
//If wl = 14 then //wl = 7 or
ATR = averagetruerange[wl](close)
IF barindex >= 2*wl+1 then

if high[wl] >= highest[2*wl+1](high) and $LastTurningPoint[wl]<=0 and $Newlow[wl]=0 then

$NewHigh[wl] = 1

If $Top2x[wl] <> 0 then
$Top1x[wl] = $Top2x[wl]
Endif

If $Top3x[wl] <> 0 then
$Top2x[wl] = $Top3x[wl]
Endif

$Top3x[wl] = barindex[wl]
$LastTurningPoint[wl]= 1

else
$NewHigh[wl] = 0
endif

if low[wl] <= lowest[2*wl+1](low) and $LastTurningPoint[wl]>=0 and $NewHigh[wl]=0 then

$NewLow[wl] = 1

If $Bot2x[wl] <> 0 then
$Bot1x[wl] = $Bot2x[wl]
Endif

If $Bot3x[wl] <> 0 then
$Bot2x[wl] = $Bot3x[wl]
Endif

$Bot3x[wl] = barindex[wl]
$LastTurningPoint[wl]= -1

else
$NewLow[wl] = 0
endif

Endif
//endif
Next

//— Gartley aka 222 pattern detection

For wl = 2 to 56 do

//If wl = 14 then //wl = 7 or

// A-t’on 4 points ?

If $Top2x[wl] <> 0 and $Bot2x[wl] <> 0 and (barindex-Max($Top3x[wl],$Bot3x[wl])) >= wl then

Delta = Close / 500 // Delta à 0.20%

If $Top2x[wl] > $Bot2x[wl] then

// Possible Gartley pattern haussier ?

PtxX = $Bot2x[wl]
PtyX = low[barindex-PtxX]
PtxA = $Top2x[wl]
PtyA = High[barindex-PtxA]
PtxB = $Bot3x[wl]
PtyB = low[barindex-PtxB]
PtxC = $Top3x[wl]
PtyC = High[barindex-PtxC]

XA = PtyA – PtyX
AB = PtyA – PtyB
BC = PtyC – PtyB
CD = PtyC – Low

If (AB >= XA*0.618*(1-marge) and AB <= XA*0.618*(1+marge)) and ((BC >= AB*0.382*(1-marge) and BC <= AB*0.382*(1+marge) and CD >= BC*1.272*(1-marge) and CD <= BC*1.272*(1+marge)) or (BC >= AB*0.886*(1-marge) and BC <= AB*0.886*(1+marge) and CD >= BC*1.618*(1-marge) and CD <= BC*1.618*(1+marge))) and (CD >= XA*0.786*(1-marge) and CD <= XA*0.786*(1+marge)) and PtyX = Lowest[PtxB-PtxX+1](Low[barindex-PtxB]) and Low = Lowest[Barindex-PtxB+1](Low) then

// 5ème point potentiel trouvé = Barindex

PtxD = Barindex
PtyD = Low

drawtriangle(PtxX,PtyX,PtxA,PtyA,PtxB,PtyB) coloured(“deepskyblue”,75) bordercolor(“deepskyblue”,200)
drawtriangle(PtxB,PtyB,PtxC,PtyC,PtxD,PtyD) coloured(“deepskyblue”,150) bordercolor(“deepskyblue”,200)

Endif
Endif

If $Top2x[wl] < $Bot2x[wl] then

// Possible Gartley pattern baissier ?

PtxX = $Top2x[wl]
PtyX = High[barindex-PtxX]
PtxA = $Bot2x[wl]
PtyA = Low[barindex-PtxA]
PtxB = $Top3x[wl]
PtyB = High[barindex-PtxB]
PtxC = $Bot3x[wl]
PtyC = Low[barindex-PtxC]

XA = PtyX – PtyA
AB = PtyB – PtyA
BC = PtyB – PtyC
CD = High – PtyC

If (AB >= XA*0.618*(1-marge) and AB <= XA*0.618*(1+marge)) and ((BC >= AB*0.382*(1-marge) and BC <= AB*0.382*(1+marge) and CD >= BC*1.272*(1-marge) and CD <= BC*1.272*(1+marge)) or (BC >= AB*0.886*(1-marge) and BC <= AB*0.886*(1+marge) and CD >= BC*1.618*(1-marge) and CD <= BC*1.618*(1+marge))) and (CD >= XA*0.786*(1-marge) and CD <= XA*0.786*(1+marge)) and PtyX = Highest[PtxB-PtxX+1](High[barindex-PtxB]) and High = Highest[Barindex-PtxB+1](High) then

// 5ème point potentiel trouvé = Barindex

PtxD = Barindex
PtyD = High

drawtriangle(PtxX,PtyX,PtxA,PtyA,PtxB,PtyB) coloured(“Red”,75) bordercolor(“Red”,200)
drawtriangle(PtxB,PtyB,PtxC,PtyC,PtxD,PtyD) coloured(“Red”,150) bordercolor(“Red”,200)

Endif
Endif

Endif
//Endif
Next

Return
How to use
- Add the indicator to a chart of the instrument and timeframe you want to analyze.
- Wait for triangles to appear: two connected triangles represent the detected Gartley structure ending at the current bar (point D).
- Confirm the context: harmonic patterns are typically used with confirmation (trend filter, momentum divergence, support/resistance, volume, or candlestick confirmation near point D).
- Adjust tolerance if needed: if you see too many/too few patterns, modify marge and re-check results.
Notes and limitations
- Multi-scale detection: Because the script loops over multiple wl values, you may see overlapping patterns.
- Repainting risk: Turning-point logic based on local extrema can change until enough bars confirm the swing; patterns may appear/disappear as new data arrives.
- No trading signals included: This is a visual detection tool (indicator). It does not place orders or provide explicit entry/exit rules.