Gann HiLo activator

Gann HiLo activator

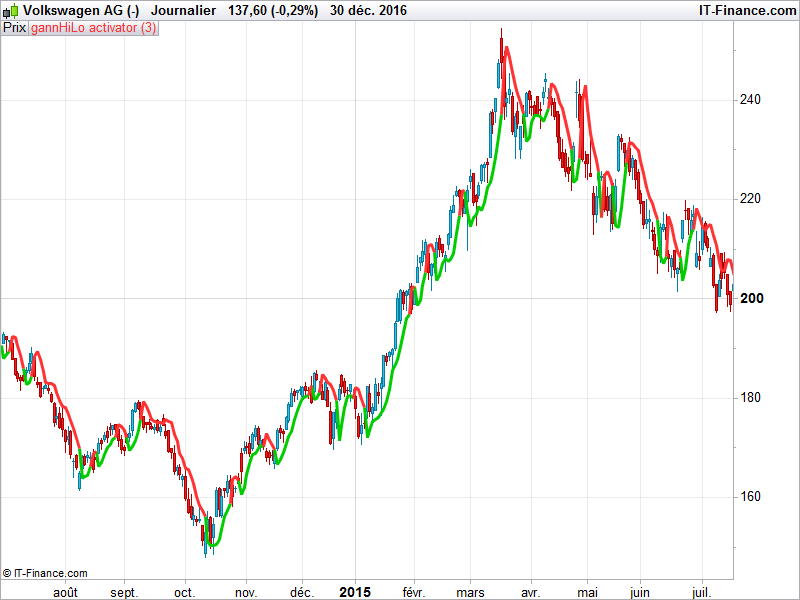
Developed by Robert Krausz, the Gann HiLo Activator is a trend-following technical indicator used to help determine the trend’s direction and to generate with-trend entry signals.

The Gann HiLo Activator is a simple moving average of the previous three periods’ highs or lows. Based on the moving averages logic, it is a trend-following indicator used to reflect the market’s direction of movement. Within the trading system we mentioned earlier, the Gann HiLo activator is responsible for generating entry signals, but also helps determine stop-loss levels.

  • Bullish Signal- When price is above the Gann Activator it shows that the trend is bullish and only Buy trades should be executed. In a bullish trend the Gann Activator uses the previous periods’ price lows for calculations.
  • Bearish Signal- When price is below the Gann Activator it shows that the trend is bearish and only Sell trades should be executed. In a bearish trend the Gann Activator uses the previous periods’ price highs for calculations.

Coded by request on forum.


Share this

Risk disclosure:

No information on this site is investment advice or a solicitation to buy or sell any financial instrument. Past performance is not indicative of future results. Trading may expose you to risk of loss greater than your deposits and is only suitable for experienced investors who have sufficient financial means to bear such risk.

ProRealTime ITF files and other attachments : How to import ITF files into ProRealTime platform?

PRC is also on YouTube, subscribe to our channel for exclusive content and tutorials

  1. maxxb • 12/31/2016 #

    salve, 
    vorrei sapere perchè nel suo grafico compare sul prezzo mentre a me compare a parte … 
    grazie

  2. AleX • 12/31/2016 #

    Sul grafico principale accanto alla voce Prezzo (vedi in alto a sinistra proprio sotto l’area di lavoro) c’è una chiave inglese, se ci clicca sopra e poi preme “Aggiungi indicatore” l’indicatore prescelto verrà inserito all’interno del grafico. Cliccando invece sul menù contestuale indicatori gli stessi verranno inseriti al di sotto del grafico “Prezzo” 
     

  3. maxxb • 12/31/2016 #

    perfetto non lo sapevo …. 
    ciao grazie..   
     

avatar
Register or

Likes

avatar avatar avatar avatar avatar
Related users ' posts
adeelq79 Great work Ivan. Thanks
Quino Another really interesting indicator. It works very well on periods below 25. Just a few cos...
supertiti hola Ivan Eso quiere decir que el Parabolic sar RSI est igual al parabolic sar de PRT ? p...
supertiti buenas tardes Ivan me gusteria tener lo mismo on chart con los puntos azules y rosas de c...
LucasBest Thanks for the translation. This one can be compared to dynamic zone RSI
Iván
1 month ago
Iván Sorry... There is a mistake in line 76. Should be if openday[i]openday[i+1] then
DLVx You do not specify how to read the Calmar ratio. Above 1 is OK and 0 is neutral? Can you she...
lee HI thank you for this indicator. Is it possible to create a screener based on this for when ...
xpe74 Hello it seems the file format does not allow to import the file. At importation stage, an e...
Iván You always can copy/paste directly from the post
roccafragius Thank you so much, for my point of view very useful!!!
NicoGB67 Excelente trabajo!!
Jrmjrm Bonsoir est-il possible d'avoir cet indicateur, mais à la place du Wilder Average, utiliser ...
geroniman merci Ivan, super indicatuer. Les cours vont souvent toucher 50% des zones vertes ou rouges....
Iván Pour ajouter une ligne supplémentaire, il suffit de créer une nouvelle variable, par exemple...
Maurizio A. excellent indicateur ! comment puis-je modifier le code pour afficher uniquement les dernier...
Iván Hi! just change line13 for this: showsignals=1
Quino Hi Excellent indicator as usual. Just 2 questions: Why LenH and LenL = 15 as Len could be...
Iván Hi! good question. This is a code request traslation from other platform. I took same inputs...

Top