

Fractals ZigZag
July 28, 2016, 7:17 PM
Indicators
31 Comments
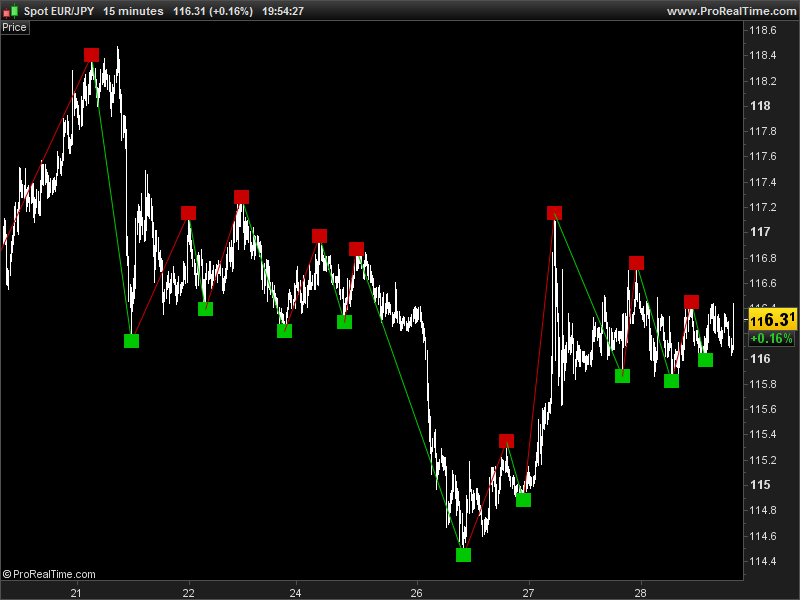
This indicator is a new attempt to draw compatible zigzag for automated trading with ProOrder.
The zigzag are drawn with the new fractal point that is contrarian to the last one.
The “cp” parameter control the depth of analysis to find fractals, higher is the value, deeper are the valleys and taller the peaks. Default value is 20.
//---external parameters
//cp = 20

once lastpoint = 0

if high[cp] >= highest[2*cp+1](high) then
 LH = 1
else
 LH = 0
endif

if low[cp] <= lowest[2*cp+1](low)  then
 LL = -1
else
 LL = 0
endif

if LH = 1 then
 TOPy = high[cp]
 TOPx = barindex[cp]
endif

if LL = -1 then
 BOTy = low[cp]
 BOTx = barindex[cp]
endif

if LH>0 and (lastpoint=-1 or lastpoint=0) then
 DRAWSEGMENT(lastX,lastY,TOPx,TOPy) COLOURED(200,0,0,255)
 DRAWTEXT("■",TOPx,TOPy,Dialog,Bold,20) coloured(200,0,0,255)
 lastpoint = 1
 lastX = TOPx
 lastY = TOPy
endif

if LL<0 and (lastpoint=1 or lastpoint=0) then
 DRAWSEGMENT(lastX,lastY,BOTx,BOTy) COLOURED(0,200,0,255)
 DRAWTEXT("■",BOTx,BOTy,Dialog,Bold,20) coloured(0,200,0,255)
 lastpoint = -1
 lastX = BOTx
 lastY = BOTy
endif

RETURN
Download
Filename:
PRC_FractalsZigZag.itf
Downloads:
1396
Master
I created ProRealCode because I believe in the power of shared knowledge. I spend my time coding new tools and helping members solve complex problems.
If you are stuck on a code or need a fresh perspective on a strategy, I am always willing to help. Welcome to the community!
Author’s Profile
Loading...