

Fractal Williams Indicator
May 11, 2018, 7:39 AM
Indicators
0 Comments
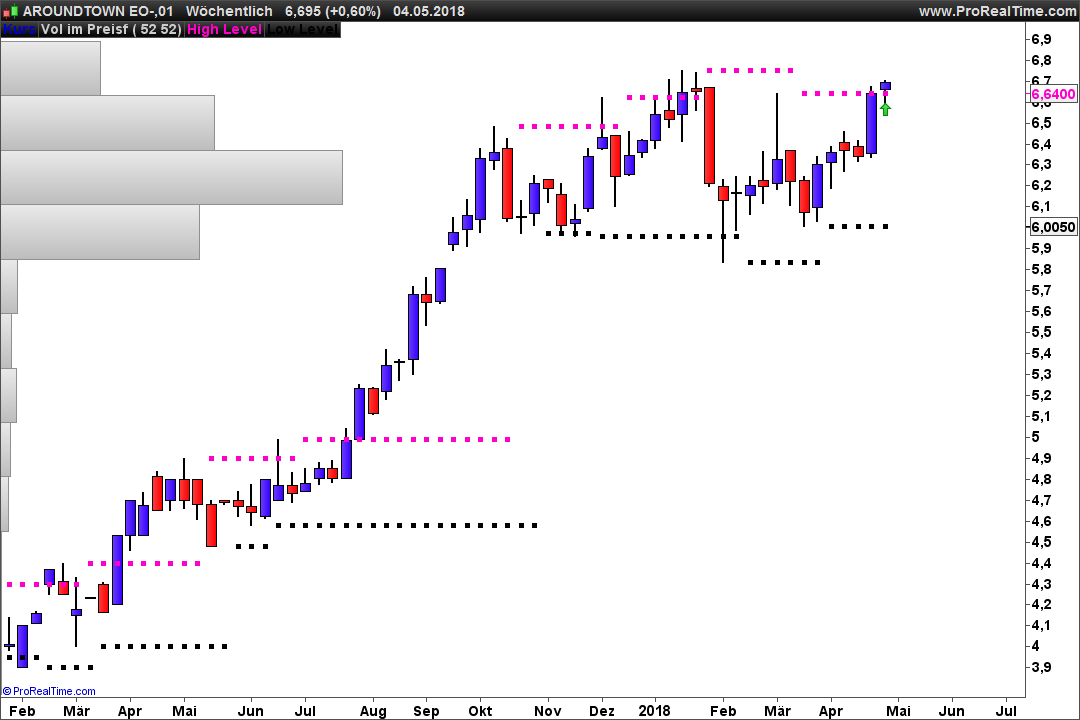
Another version of the classic Bill Williams indicator: Fractal.
The last two Fractals are plotted with lines on the price chart.
Fractals are highest high or lowest low of the last 3 candles.
//----- Highs -----
ONCE HighCount = Undefined
ONCE HighFractal = Undefined


IF (High > High[1]) AND (High > High[2]) THEN
HighLevel = High
ENDIF

IF (High < HighLevel) THEN
 HighCount = HighCount - 1
ELSIF (High >= HighLevel) THEN
 HighCount = 0
ENDIF

IF HighCount = -2 THEN
 HighFractal = HighLevel
ELSE
 HighFractal = HighFractal
ENDIF
//----- Lows -----
ONCE LowCount = Undefined
ONCE LowFractal = Undefined

IF (Low < Low[1]) AND (Low < Low[2]) THEN
 LowLevel = Low
ENDIF

IF (Low > LowLevel) THEN
 LowCount = LowCount + 1
ELSIF (Low <= LowLevel) THEN
 LowCount = 0
ENDIF

IF LowCount = 2 THEN
 LowFractal = LowLevel
ELSE
 LowFractal = LowFractal
ENDIF

RETURN HighFractal as "High Level", LowFractal as "Low Level"
Download
Filename:
Fractal-Williams-indicator.itf
Downloads:
782
Veteran
secundary school-education to banker staff-multiple host part time - economist partime like: reading-thinking biases and chess.
Author’s Profile
Loading...