Follow Line Indicator

v10.3
Follow Line Indicator

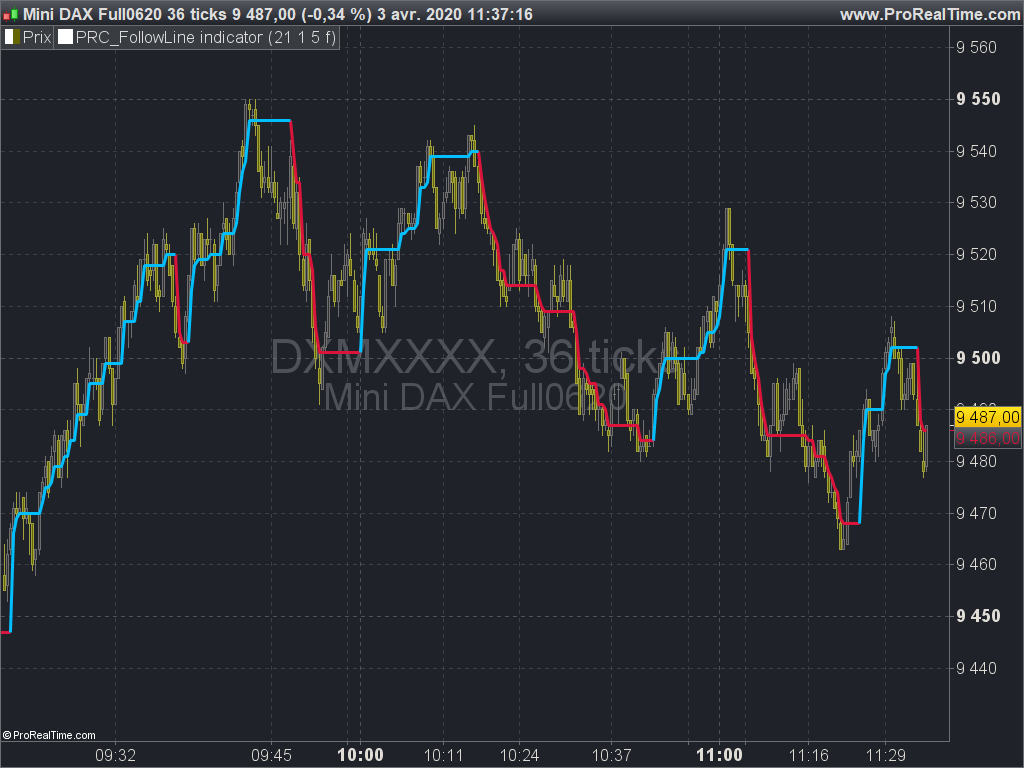
The FollowLine indicator is a trend following indicator. The blue/red lines are activated when the price closes above the upper Bollinger band or below the lower one.

Once the trigger of the trend direction is made, the FollowLine will be placed at High or Low (depending of the trend).

An ATR filter can be selected to place the line at a more distance level than the normal mode settled at candles Highs/Lows.


Share this

Risk disclosure:

No information on this site is investment advice or a solicitation to buy or sell any financial instrument. Past performance is not indicative of future results. Trading may expose you to risk of loss greater than your deposits and is only suitable for experienced investors who have sufficient financial means to bear such risk.

ProRealTime ITF files and other attachments : How to import ITF files into ProRealTime platform?

PRC is also on YouTube, subscribe to our channel for exclusive content and tutorials

  1. DaxRider • 04/03/2020 #

    Nice indicator thank you Nicolas

  2. sai000 • 04/03/2020 #

    can i use this in trading view plotform

    • Nicolas • 04/03/2020 #

      No, all codes on our website are to be used with ProRealTime: https://www.prorealtime.com/en/

  3. dg007 • 04/03/2020 #

    BUON GIORNO E’ POSSIBILE AVERE UN CHIARIMENTO?GRAZIE MILLE

    • Nicolas • 04/03/2020 #

      Poni qui la tua domanda se è correlata a questo indicatore, altrimenti apri un nuovo argomento nel forum appropriato e segui le regole di pubblicazione. Grazie.

  4. PhilipSchultz • 04/03/2020 #

    Hi Nicolas, can i backtest this indicator? And if so, how do i do it? I have tried, but don´t suce

    • Nicolas • 04/03/2020 #

      Sure, use the forums to create a new topic to ask for it
      Please respect the posting rules and describe precisely your query.

  5. supertiti • 345 days ago #

    Bonjour Nicolas,
    Je ne comprend pas bien , le trend change de couleur quand les prix sont au dessus/dessous des bandes de Bollinger;
    mais quand les prix reviennent à l’intérieur la couleur reste identique.
    Serait-il possible d’avoir une troisième couleur dans cette zone “neutre”
    merci ,bonne journée

    • Nicolas • 345 days ago #

      Oui ce serait possible, cependant l’indicateur est bien prévu pour conserver la couleur de la même tendance tant qu’on ne traverse pas le côté opposé des bandes de Bollinger.

  6. supertiti • 345 days ago #

    Quand tu pourras si tu peux nous coder la troisième couleur cela améliorerait les trades court terme.

    merci beaucoup.

avatar
Register or

Likes

avatar avatar avatar avatar avatar avatar avatar avatar avatar avatar avatar avatar avatar avatar avatar avatar

+15 more likes

Related users ' posts
JS
9 months ago
Trendilo
Trendilo
0
Indicators
superfalcio Hello, very interesting. Do you have already some tested condiction including timeframe and ...
Nicolas
9 months ago
Anthony2A Bjr, j ai des erreurs sur la ligne 69, 74, 78 et 80. sur drawcandle drawtext et endif. si ...
Lucas0000 Hello, Congratulations on this programming, it seems incredible to me, I am new to this but ...
plbourse Hello, I am trying to use this singal (in fact I have converted it to an indicateur giving B...
BriceE Bonjour Nicolas, Je suis a la recherche d'indicateurs pour me donner la meilleure indicatio...
Nicolas
11 months ago
Maxime Baudin Well done Nicolas, creative!
Stenozar Hi Nicolas, please can you explain how to read/use this indicator? thanks!
FXtonio @RICOU en 1 minutes avec un filtre de tendance ZLSMA 200 et eventuellement un rsi 7 , 69% de...
JC_Bywan For people interested in the screener: https://www.prorealcode.com/topic/screener-buy-sell-m...
octum Gracias NJicolas. Las lineas 35 y 36 dan fallo. (¿Es adrede para iniciados?) Puedes co...
Nicolas Yes, Magic if the variable that contains the value of the line, you can test if it goes up o...
dadah1987 Bonjour Nicolas, merci pour cet indicateur. Utilisant pour l'instant la création simplifié p...
Nicolas Merci d'ouvrir un sujet sur le forum avec une description complète du système.
GustavoLoboOrenstein Is it possible to add histogram with only increasing bars?
Nicolas Je ne rencontre pas ce problème avec le NASDAQ par exemple, ce serait plus simple d'ouvrir u...
YvesRobert Bonjour Nicolas, en effet ca marche, je me suis trompé, j'ai bien tout le tracé. C'est parce...
oliTR Bonjour, les conditions longCond et shortCond ne contiennent-elles pas une condition qui s'a...
geroniman bonjour si je comprends bien, qaund els points sont verts on regarde pour un long, le blanc ...
Alfy No, the dots only show the compression of the volatility. There are 3 levels of "squeeze" wh...
ted.hulsman Hi Alfy, I'm trying to understand your indicator, so I made the Bollinger Bands and the Kelt...
Khaled Thank you Nicolas! Looks like TDI (Trader Dynamic Index). Interesting to give Exit Signal as...
Nicolas ColorBetween is an instruction added last year: https://www.prorealcode.com/documentation/co...
Jiacky
2 years ago
Kalman Filter
Kalman Filter
0
Indicators
Stenozar Hi Sever, how can I visualize the coloured areas?
Sever Hi Stenozar, You need to add the color zones yourself , just go to Add Color Zone To set ...
atlante hi nicolas this indicator have 2 wrong borderline and islalastbarupdate. thank you can you h...
Nicolas That'"s because you are not using PRT v11? Just remove lines 59 to 62
Kanamax Hi Roberto, sorry for my confusing previous posts (forget them). My request is very simple,...
robertogozzi Please start a new topic in ProOrder support.
robertogozzi There you go: myMagicTrend = CALL “Magic Trend custom”[20, 14, 1, 5] alpha = 105 b = 0...
johann8 exactly :) Thank you all for the help!
max_92 Ciao Roberto, ho scaricato l'indicatore e come ti avevano già scritto sopra anch'io vedo la ...

Top