

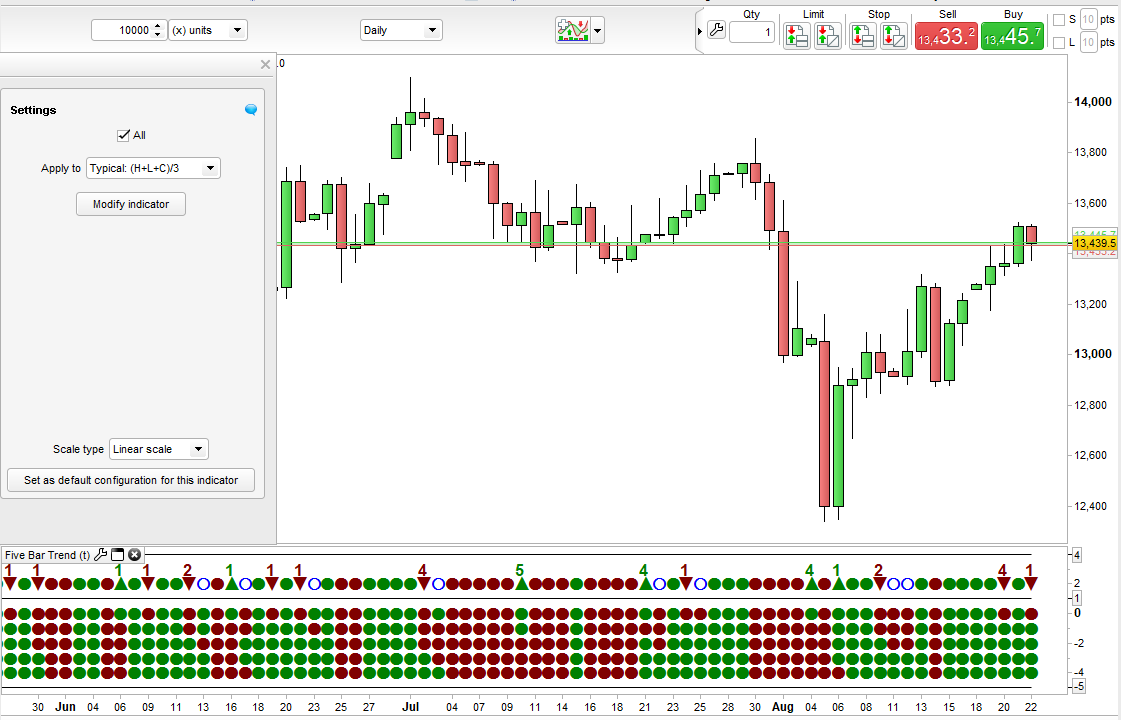
Five Bar Trend Dashboard
This indicator creates a dashboard of dots to show the trend in five time frames.
So for example on a 5 minute time frame it calculates what a 5 minute, 10 minute, 15 minute, 20 minute and 25 minute candle would be and on a daily chart it would calculate what 1 day, 2 day, 3 day, 4 day and 5 day candles would be. It then compares the current price to those candles. It can the compare closing price to the open, median price, typical price, total price and weighted close price. It then draws five dots to show whether the comparison is down or up for each time frame. The upper of the five dots represents the fastest time frame candle comparison (so 5 minutes on a 5 minute chart) and the lowest dot is the slowest comparison (so 25 minutes on a 5 minute chart).
The separate upper row shows a red dot if all the time frame dots below are red and a green dot is all the time frame dots below are green. If they are mixed then an empty blue circle is drawn. If a set of 5 red or 5 green dots is followed by a mixed row of dots then an up arrow or down arrow is shown to highlight a possible market reversal after a strong trend. The number above this arrow highlights how long the previous run of five same colour dots has gone on for. This number can help analyse how strong the run was and can be used for position sizing or just to assist in deciding how likely a reversal is to be.
Change the price that you compare to by changing the ‘customclose’ value in the indicator window. If you select open,close,high or low then the comparison is always open to close. The others are close to typical price or close to median price etc.
By ticking or unticking ‘All’ you can remove the dots representing the five time frames. This allows the indicator to be reduced down in size so as to take up less chart space.
I suggest downloading and importing the ITF file to get full functionality.
//Five Bar Trend
//By Vonasi
//20190822

m5 = customclose

m10h = highest[2](high)
m10l = lowest[2](low)
m10o = open[1]

m15h = highest[3](high)
m15l = lowest[3](low)
m15o = open[2]

m20h = highest[4](high)
m20l = lowest[4](low)
m20o = open[3]

m25h = highest[5](high)
m25l = lowest[5](low)
m25o = open[4]

if customclose = typicalprice then
 m10 = (m10h + m10l + close)/3
 m15 = (m15h + m15l + close)/3
 m20 = (m20h + m20l + close)/3
 m25 = (m25h + m25l + close)/3
endif

if customclose = medianprice then
 m10 = (m10h + m10l)/2
 m15 = (m15h + m15l)/2
 m20 = (m20h + m20l)/2
 m25 = (m25h + m25l)/2
endif

if customclose = totalprice then
 m10 = (m10h + m10l + m10o + close)/4
 m15 = (m15h + m15l + m15o + close)/4
 m20 = (m20h + m20l + m20o + close)/4
 m25 = (m25h + m25l + m25o + close)/4
endif

if customclose = weightedclose then
 m10 = (m10h + m10l + (2 * close))/4
 m15 = (m15h + m15l + (2 * close))/4
 m20 = (m20h + m20l + (2 * close))/4
 m25 = (m25h + m25l + (2 * close))/4
endif

if customclose = close or customclose = open or customclose = high or customclose = low then
 m5 = open
 m10 = m10o
 m15 = m15o
 m20 = m20o
 m25 = m25o
endif

up = 0
down = 0

if close < m5 then
 if all then
  drawtext("●",barindex,0,SansSerif,Bold,16)coloured(128,0,0)
 endif
 down = down + 1
endif
if close > m5 then
 if all then
  drawtext("●",barindex,0,SansSerif,Bold,16)coloured(0,128,0)
 endif
 up = up + 1
endif

if close < m10 then
 if all then
  drawtext("●",barindex,-1,SansSerif,Bold,16)coloured(128,0,0)
 endif
 down = down + 1
endif
if close > m10 then
 if all then
  drawtext("●",barindex,-1,SansSerif,Bold,16)coloured(0,128,0)
 endif
 up = up + 1
endif

if close < m15 then
 if all then
  drawtext("●",barindex,-2,SansSerif,Bold,16)coloured(128,0,0)
 endif
 down = down + 1
endif
if close > m15 then
 if all then
  drawtext("●",barindex,-2,SansSerif,Bold,16)coloured(0,128,0)
 endif
 up = up + 1
endif

if close < m20 then
 if all then
  drawtext("●",barindex,-3,SansSerif,Bold,16)coloured(128,0,0)
 endif
 down = down + 1
endif
if close > m20 then
 if all then
  drawtext("●",barindex,-3,SansSerif,Bold,16)coloured(0,128,0)
 endif
 up = up + 1
endif

if close < m25 then
 if all then
  drawtext("●",barindex,-4,SansSerif,Bold,16)coloured(128,0,0)
 endif
 down = down + 1
endif
if close > m25 then
 if all then
  drawtext("●",barindex,-4,SansSerif,Bold,16)coloured(0,128,0)
 endif
 up = up + 1
endif

if down = 5 then
 drawtext("●",barindex,2,SansSerif,Bold,16)coloured(128,0,0)
 dcount = dcount + 1
 ucount = 0
endif

if up = 5 then
 drawtext("●",barindex,2,SansSerif,Bold,16)coloured(0,128,0)
 dcount = 0
 ucount = ucount + 1
endif

if not all then
 top = 4
 middle = 1
 bottom = 1
else
 top = 4
 middle = 1
 bottom = -5
endif

flag = 0
if down[1] = 5 and down <> 5 and up <> 5 then
 drawtext("▲",barindex,2,SansSerif,Bold,16)coloured(0,128,0)
 a = dcount[1]
 drawtext("#a#",barindex,3,SansSerif,Bold,16)coloured(0,128,0)
 dcount = 0
 flag = 1
endif

if up[1] = 5 and down <> 5 and up <> 5 then
 drawtext("▼",barindex,2,SansSerif,Bold,16)coloured(128,0,0)
 a = ucount[1]
 drawtext("#a#",barindex,3,SansSerif,Bold,16)coloured(128,0,0)
 ucount = 0
 flag = 1
endif

if flag = 0 and up <> 5 and down <> 5 then
 drawtext("○",barindex,2,SansSerif,Bold,16)coloured(0,0,255)
endif

return top,middle,bottom