

Fisher index indicator
February 3, 2017, 2:10 PM
Indicators
0 Comments
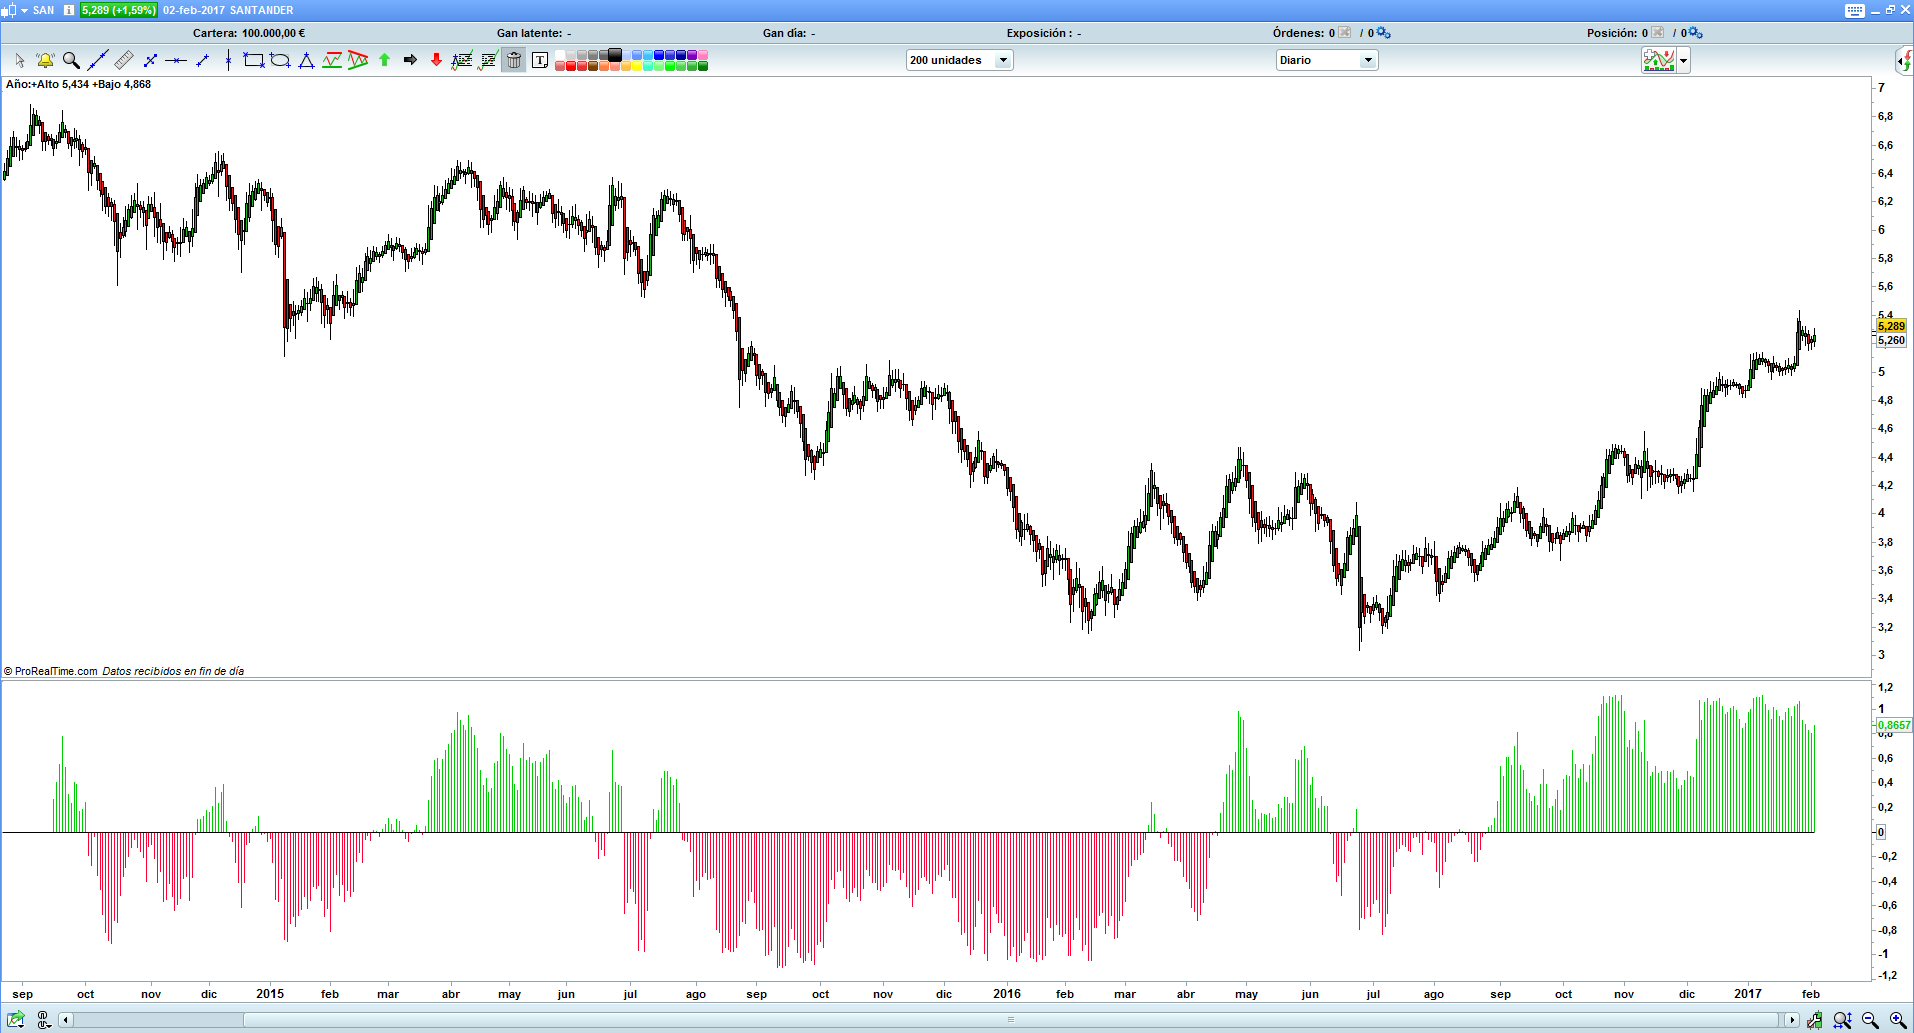
Fisher indicator on positive / negative green / red histogram or colors to choose.
Variable p can be modified from properties
// variable p = 89

//Fisher indicator en histograma verde/rojo positivo/negativo o colores a elegir.

//variable p puede modificarse desde propiedades

Once period = p

Once priceSmoothing = 0.3

Once indexSmoothing = 0.3

cero = 0

lowestLow = Lowest[period](Low)

highestHigh = Highest[period](High)

periodRange = highestHigh - lowestLow

midPrice = (High + Low) / 2

priceLocation = 2.0 * ((midPrice - lowestLow) / periodRange) - 1.0

If smoothedLocation[1] then

smoothedLocation = priceSmoothing*smoothedLocation[1] + (1.0 - priceSmoothing)*priceLocation

Else

smoothedLocation = (1.0 - priceSmoothing)*priceLocation

Endif

If smoothedLocation > 0.99 then

smoothedLocation = 0.99

Elsif smoothedLocation < -0.99 then

smoothedLocation = -0.99

Endif

fishIndex = Log((1+smoothedLocation)/(1-smoothedLocation))

If smoothedFish[1] then

smoothedFish = indexSmoothing*smoothedFish[1] + (1.0 - indexSmoothing)*fishIndex

Else

smoothedFish = (1.0 - indexSmoothing)*fishIndex

Endif

Return smoothedFish as "Fisher Index", cero
Download
Filename:
Fisher-indicator.itf
Downloads:
280
Average
Currently debugging life, so my bio is on hold. Check back after the next commit for an update.
Author’s Profile
Loading...