Finite Volume Element (FVE)

Finite Volume Element (FVE)

FVE is a money flow indicator but with two important differences from existing money flow indicators:

It resolves contradictions between intraday money flow indicators (such as Chaikin’s money flow) and interday money flow indicators (like On Balance Volume) by taking into account both intra- and interday price action.
Unlike other money flow indicators which add or subtract all volume even if the security closed just 1 cent higher than the previous close, FVE uses a volatility threshold to take into account minimal price changes.
The FVE provides 3 types of signals:

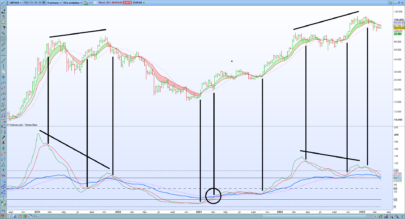
The strongest signal is divergence between price and the indicator. Divergence can provide leading signals of breakouts or warnings of impending corrections. The classic method for detecting divergence is for FVE to make lower highs while price makes higher highs (negative divergence). An alternative method is to draw the linear regression line on both charts, and compare the slopes. A logical buy signal would be for FVE, diverging from price, to rise sharply and make a series higher highs and/or higher lows.
The most obvious and coincident signal is the slope of the FVE line. An upward slope indicates that the bulls are in control and the opposite for downward.
This is a unique and very important property of this indicator. Values above zero are bullish and indicate accumulation while values below zero indicate distribution. FVE crossing the zero line indicates that the short to intermediate balance of power is changing from the bulls to the bears or vice versa. The best scenario is when a stock is in the process of building a base, and FVE diverges from price and rises to cross the zero line from below, at a sharp angle. Conversely the crossing of the zero line from above is a bearish signal to liquidate positions or initiate a short trade.

Parameters

FVE period (p = 22)

Share this

Risk disclosure:

No information on this site is investment advice or a solicitation to buy or sell any financial instrument. Past performance is not indicative of future results. Trading may expose you to risk of loss greater than your deposits and is only suitable for experienced investors who have sufficient financial means to bear such risk.

ProRealTime ITF files and other attachments : How to import ITF files into ProRealTime platform?

PRC is also on YouTube, subscribe to our channel for exclusive content and tutorials

avatar
Register or

Likes

avatar avatar avatar avatar
Related users ' posts
MaoRai54 dear Ivan, it seems to be very interesting but please clarify what are all the lines I see i...
Iván Hi! you have the answer in the last line of code... MacdMiddle as "histo" style(histogra...
kats Le Top , a utiliser avec le nuage violet et alerte TN pour plus de précision.
roccafragius Hello Ivan, another great Indicator, very useful to trace the trend ( blue line) and the pos...
Iván Hi! yes. You can ask for it here: https://www.prorealcode.com/free-code-conversion/
roccafragius Thank you so much Ivan! I created this request in english Translate from TradingView Indicat...
ipbvba Hello, Is it possible to have a screener for the various buy and sell signals?
Regisnew très bel indicateur merci
jordan //---settings MAmode=0 Period=150 NumberOfMA=100 //---end of settings MA2=undefined ...
jordan dites moi si cela correspond à ce que vous cherchez
kats bonjour merci de ta reponse mais non ca fonctionne pas sympa quand même d'avoir essayé cdlt
Jean2139 Bonjour Yvan, Merci pour ton indicateur que je trouve très intéressant. Je suppose que tu ...
Suffi Hier eine kleine Korrektur: //-----Inputs-----------------------------------------// MALengt...
NicoGB67 Hola Iván, intento crear un proscreener automático con este indicador al igual que se puede ...
Iván Hola. Sí se puede, tendrás que hacerlo programando. Así, eliminando toda la parte de código ...
Cyril18 Thank you Ivan, great job Would it be possible to add in the sript the possibility of conne...
Iván
9 months ago
Iván Hola javier gracias! es importante realizar buenos backtest antes de lanzarse al mercado y ...
achel I have an error with "fillcolor" - How to solve this? / J'ai une erreur avec "fillcolor" - C...
Iván Hi! This is because you are not with V12. Just delete fillcolor
Patriot1972 Ciao Ivan, avevo bisogno di chiarimenti sul funzionamento del tuo indicatore: cosa segnala q...
Fgats Ivan can you please explain a line of code that is puzzling me. This is line 37 . As I unde...
teshmi9z Hola, ¿es posible detectar cuándo el precio regresa a la zona del 61 al 88 % de Fibonacci y,...
elcortijoverde Gracias Iván,...sigo tus videos en Youtube. Ya estoy con la V12 y se descarga, pero algo est...
elcortijoverde Bueno, ya aparecen las velas, pero ahora, cada fin de vela aparece un nuevo pronóstico y no ...
Roger Gracias por compartir, pero no tengo ninguna predicción. @Ivan @elcortijoverde ¿qué modifica...
luxrun grazie Ivàn!
lee Thank you. Is it possible to convert this to a screener that displays instruments when bulli...
Iván //---------------------------------------------------------------// //PRC_Pollan Indicator /...
Faisalx ChatGPT Hola Iván. Gracias por tu excelente trabajo. Te agradecería si pudieras echarle un...
Iván ok, perfecto! me pongo con ello
ARNAUD20 J'ai, télécharger le logiciel : falling-and-rising-3-methods.itf : rien se passe sur le grap...
DeathMetal C'est un modèle assez rare, essayez-le sur un petit laps de temps, par exemple 5 minutes et ...
BEBERD serait-il possible d avoir le code pour en daily et weekly ? merci bien
kats Bonjour, J'ai une question etes vous trader? Je m'explique , j'ai téléchargé tous les indi...
Faisalx Hola Ivan. Thanks for your great job. I would appreciate if you have look at my request http...
roccafragius Thank you for all these useful information!! Very great job Ivan! THank you so much
geroniman Merci Ivan, super travail. On peut toujours compter sur toi pour apporter des innovations su...

Top