

Fibonacci Confluence Toolkit
This article introduces the Fibonacci Confluence Toolkit.
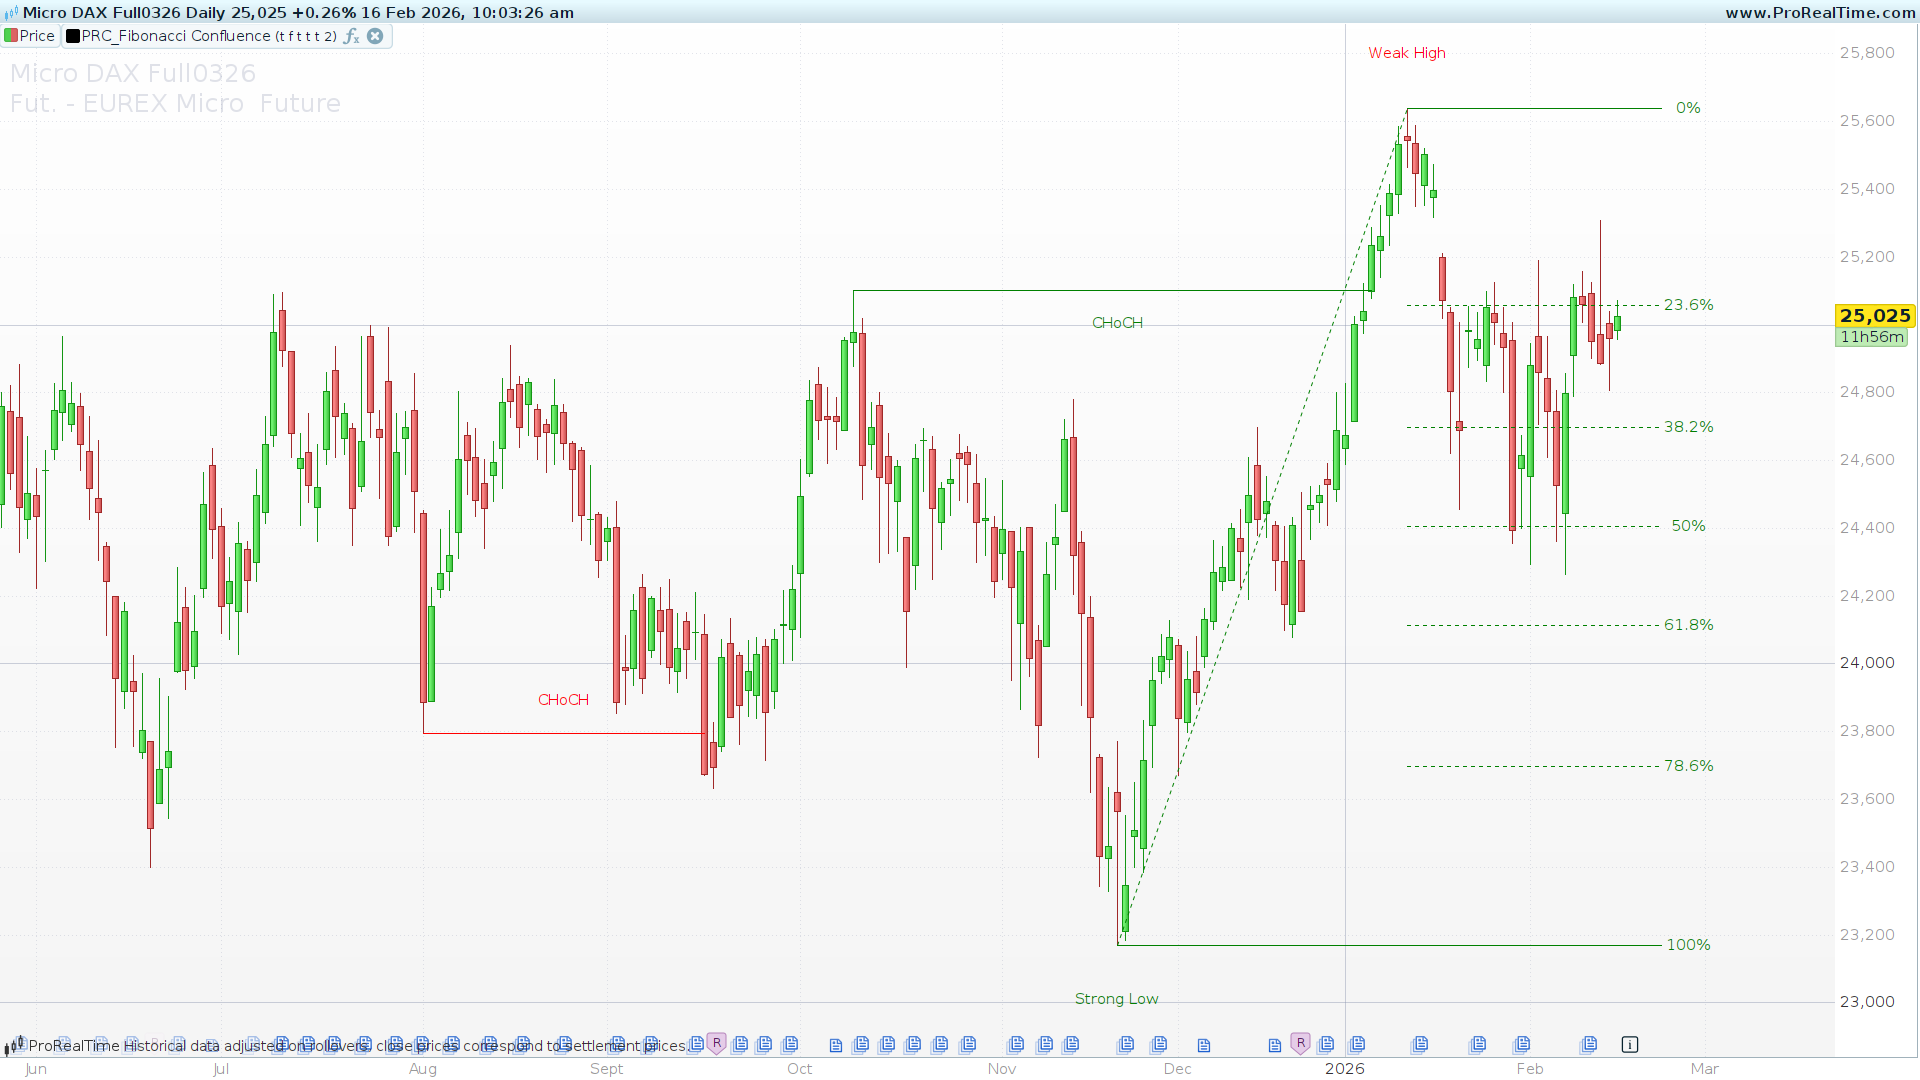
Developed by LuxAlgo to identify high-probability reversal zones and trend continuations, this indicator merges three critical trading pillars: Smart Market Structure, Automated Fibonacci Levels, and Contextual Price Action.
The Power of Confluence
In trading, “confluence” occurs when multiple independent signals align at the same price level. The Fibonacci Confluence Toolkit automates this process by tracking structural shifts and projecting key retracement levels only when the market confirms a change in bias.
Core Functionalities
1. Multi-Depth Swing Detection
The indicator utilizes a sophisticated three-tier detection system to define the market’s trend:
- Short-Term (ST) Swings: Captures immediate price fluctuations.
- Intermediate-Term (IT) Swings: Filters noise by requiring specific ST patterns to form a peak or trough.
- Long-Term (LT) Swings: The most significant levels, used to anchor the automated Fibonacci retracements.
2. Change of Character (CHoCH)
Instead of simple moving average crossovers, this toolkit identifies structural shifts through Change of Character (CHoCH).
- Bullish CHoCH: Occurs when the price closes above a significant LT High while the previous bias was bearish.
- Bearish CHoCH: Occurs when the price closes below a significant LT Low while the previous bias was bullish.
The indicator draws a horizontal segment and a label to highlight these critical pivot points.
3. Automated Fibonacci Retracements
Once a structural shift (CHoCH) is confirmed, the indicator automatically anchors a Fibonacci grid from the structural swing high to the swing low. It displays the following key levels:
- Golden Ratio (61.8%) and 78.6%: Critical for identifying “Deep Discount” entry zones.
- Equilibrium (50%): A neutral zone used to gauge trend strength.
- 23.6% and 38.2%: Often used for shallow pullbacks in aggressive trends.
4. Strong and Weak Highs/Lows
The toolkit applies supply and demand logic to label the most recent swings:
- Strong Low/High: A level that successfully created a new structural high or low. These are protected levels where traders typically place stop-losses.
- Weak Low/High: Levels that failed to break the previous structure and are often targeted as liquidity.
Smart Engulfing Patterns
Traditional engulfing patterns often yield false signals in ranging markets. This indicator includes a Structure-Based Engulfing Mode:
- It only displays Bullish Engulfing signals if they occur within a Bullish structural zone.
- It only displays Bearish Engulfing signals if they occur within a Bearish structural zone.
This filtering significantly increases the “hit rate” of these price action signals.
Settings and Customization
The toolkit is highly customizable, allowing you to tailor the visual output to your specific strategy. By clicking the wrench icon in your indicator settings, you can modify the following:
bullCHoCHs / bearCHoCHs– Toggle the visibility of Bullish and Bearish structural shifts.
bullshow / bearshow– Show or hide the automated Fibonacci grids.
showHLSwings– Toggles the labels for Strong/Weak Highs and Lows.
engulfMode– 0 = Disabled; 1 = Show All; 2 = Filter by market structure.
Practical Application
- Entries: Look for a Bullish CHoCH followed by a pullback into the 61.8% or 78.6% Fibonacci levels.
- Confluence: An Engulfing Pattern appearing exactly on a Fibonacci level within a “Strong Low” zone is a high-probability trade signal.
- Exits: Use the Weak High/Low as your primary profit target.
ProBuilder Code
//------------------------------------------------
// PRC_Fibonacci Confluence Toolkit (by LuxAlgo)
// version = 1
// 29.01.2026
// Iván González @ www.prorealcode.com
//------------------------------------------------
defparam drawonlastbaronly=true
//------------------------------------------------
//----- Inputs -----
//------------------------------------------------
// Market Patterns
bullCHoCHs = 1          // 1=mostrar, 0=ocultar
bearCHoCHs = 1          // 1=mostrar, 0=ocultar
// Retracement Levels (1=show, 0=hide)
bearshow=1
bullshow=1
// Swing Levels & Engulfing
showSwings = 1          // 1=HH/HL/LH/LL, 0=disabled
showHLSwings = 1        // Strong/Weak High/Low
engulfMode = 2          // 0=disabled, 1=all, 2=structure based
//------------------------------------------------
// Generic Variables
//------------------------------------------------
n = barindex
atr = averagetruerange[14](close)
//fibolevels
once value0 = 0
once value0236 = 0.236
once value0382 = 0.382
once value05 = 0.5
once value0618 = 0.618
once value0786 = 0.786
once value1 = 1
// Market Structure state
once ltMS = 0
once ltMSPrev = 0
//------------------------------------------------
// Short Term Swings Detection (1 bar lookback)
//------------------------------------------------
// ST High: high[1] es mayor que sus vecinos
stHighDetected = high[1] > high and high[1] > high[2]
// ST Low: low[1] es menor que sus vecinos
stLowDetected = low[1] < low and low[1] < low[2]
// Actualizar estado ST High
if stHighDetected then
   stHPrevPrice = stHMidPrice
   stHMidPrice = stHLastPrice
   stHLastPrice = high[1]
   stHPrevIndex = stHMidIndex
   stHMidIndex = stHLastIndex
   stHLastIndex = n - 1
endif
// Actualizar estado ST Low
if stLowDetected then
   stLPrevPrice = stLMidPrice
   stLMidPrice = stLLastPrice
   stLLastPrice = low[1]
   stLPrevIndex = stLMidIndex
   stLMidIndex = stLLastIndex
   stLLastIndex = n - 1
endif
//------------------------------------------------
// Intermediate Term Swings (based on ST patterns)
//------------------------------------------------
// IT Low: patrón swing low en ST (prev > mid <= last)
itLowPattern = stLPrevPrice > stLMidPrice and stLMidPrice <= stLLastPrice and stLMidPrice > 0
// Detectar nuevo IT Low
if itLowPattern and itLowPattern <> itLowPattern[1] then
   itLPrevPrice = itLMidPrice
   itLMidPrice = itLLastPrice
   itLLastPrice = stLMidPrice
   itLPrevIndex = itLMidIndex
   itLMidIndex = itLLastIndex
   itLLastIndex = stLMidIndex
endif
// IT High: patrón swing high en ST (prev < mid >= last)
itHighPattern = stHPrevPrice < stHMidPrice and stHMidPrice >= stHLastPrice and stHMidPrice > 0
// Detectar nuevo IT High
if itHighPattern and itHighPattern <> itHighPattern[1] then
   itHPrevPrice = itHMidPrice
   itHMidPrice = itHLastPrice
   itHLastPrice = stHMidPrice
   itHPrevIndex = itHMidIndex
   itHMidIndex = itHLastIndex
   itHLastIndex = stHMidIndex
endif
//------------------------------------------------
// Long Term Swings (based on IT patterns) + CHoCH Detection
//------------------------------------------------
// LT Low: patrón swing low en IT
ltLowPattern = itLPrevPrice > itLMidPrice and itLMidPrice <= itLLastPrice and itLMidPrice > 0
// Detectar nuevo LT Low
if ltLowPattern and ltLowPattern <> ltLowPattern[1] then
   ltLLastPrice = itLMidPrice
   ltLLastIndex = itLMidIndex
   ltLCross = 0
   // Si estructura bajista activa y midiendo, activar Fibs
   if ltMS = -1 and ltMSPrev <> ltMS and ltLMeasure = 0 then
      ltLMeasure = 1
      bearFibActive = 1
      bearFibHighIndex = bearFibLn1X
      bearFibHighPrice = ltLZoneTop
      bearFibLowIndex = itLMidIndex
      bearFibLowPrice = itLMidPrice
   endif
endif
// LT High: patron swing high en IT
ltHighPattern = itHPrevPrice < itHMidPrice and itHMidPrice >= itHLastPrice and itHMidPrice > 0
// Detectar nuevo LT High
if ltHighPattern and ltHighPattern <> ltHighPattern[1] then
   ltHLastPrice = itHMidPrice
   ltHLastIndex = itHMidIndex
   ltHCross = 0
   // Si estructura alcista activa y midiendo, activar Fibs
   if ltMS = 1 and ltMSPrev <> ltMS and ltHMeasure = 0 then
      ltHMeasure = 1
      bullFibActive = 1
      bullFibHighIndex = itHMidIndex
      bullFibHighPrice = itHMidPrice
      bullFibLowIndex = bullFibLn1X
      bullFibLowPrice = ltHZoneBot
   endif
endif
//------------------------------------------------
// Bearish CHoCH Detection (close crosses under ltLLastPrice)
//------------------------------------------------
if close crosses under ltLLastPrice and ltLCross = 0 and ltLLastPrice > 0 then
   ltLCross = 1
   if ltMS = 1 then
      // CHoCH bajista detectado (cambio de alcista a bajista)
      ltLisCHoCH = 1
      ltLMeasure = 0
      // Guardar datos del CHoCH
      bearChochX = ltLLastIndex
      bearChochY = ltLLastPrice
      bearChochRight = n
      bearChochActive = 1
      // Buscar el máximo entre el swing y la ruptura para Area of Interest
      refValue = high
      refIndex = n
      for i = 1 to (n - ltLLastIndex) do
         if high[i] > refValue then
            refValue = high[i]
            refIndex = n - i
         endif
      next
      // Guardar para Fib nivel 1
      bearFibLn1X = refIndex
      bearFibLn1Y = refValue
      // Zone coordinates
      ltLZoneTop = refValue
      ltLZoneBot = ltLLastPrice
      ltLZoneLeft = n
      ltLZoneRight = n + 1
      ltLwest = low
      ltLhghst = refValue
   else
      ltLisCHoCH = 0
   endif
   ltMSPrev = ltMS
   ltMS = -1
endif
// Extender zona si sigue activa
if ltLisCHoCH = 1 and ltLMeasure = 0 then
   if high < ltLhghst then
      ltLZoneRight = n + 1
   else
      ltLisCHoCH = 0
   endif
endif
//--------------------------------------------------------------------------------//
// Bullish CHoCH Detection (close crosses over ltHLastPrice)
//--------------------------------------------------------------------------------//
if close crosses over ltHLastPrice and ltHCross = 0 and ltHLastPrice > 0 then
   ltHCross = 1
   if ltMS = -1 then
      // CHoCH alcista detectado (cambio de bajista a alcista)
      ltHisCHoCH = 1
      ltHMeasure = 0
      // Guardar datos del CHoCH
      bullChochX = ltHLastIndex
      bullChochY = ltHLastPrice
      bullChochRight = n
      bullChochActive = 1
      // Buscar el mínimo entre el swing y la ruptura para Area of Interest
      refValue = low
      refIndex = n
      for i = 1 to (n - ltHLastIndex) do
         if low[i] < refValue then
            refValue = low[i]
            refIndex = n - i
         endif
      next
      // Guardar para Fib nivel 1
      bullFibLn1X = refIndex
      bullFibLn1Y = refValue
      // Zone coordinates
      ltHZoneTop = ltHLastPrice
      ltHZoneBot = refValue
      ltHZoneLeft = n
      ltHZoneRight = n + 1
      ltHlwest = refValue
      ltHhghst = high
   else
      ltHisCHoCH = 0
   endif

   ltMSPrev = ltMS
   ltMS = 1
endif

// Extender zona si sigue activa
if ltHisCHoCH = 1 and ltHMeasure = 0 then
   if low > ltHlwest then
      ltHZoneRight = n + 1
   else
      ltHisCHoCH = 0
   endif
endif
//------------------------------------------------
// Engulfing Patterns
//------------------------------------------------
bodyHi = max(close, open)
bodyLo = min(close, open)
body = bodyHi - bodyLo
bodyAvg = average[14](body)
smallBody = body < bodyAvg
longBody = body > bodyAvg
whiteBody = open < close
blackBody = open > close
// Bearish Engulfing
bearishEngulfing = blackBody and longBody and whiteBody[1] and smallBody[1] and close <= open[1] and open >= close[1] and (close < open[1] or open > close[1])
// Bullish Engulfing
bullishEngulfing = whiteBody and longBody and blackBody[1] and smallBody[1] and close >= open[1] and open <= close[1] and (close > open[1] or open < close[1])
// Filtrar por estructura si engulfMode = 2
if engulfMode = 2 then
   if bearishEngulfing and ltLisCHoCH = 1 and ltLMeasure = 0 and close > ltLZoneBot then
      bearEngulfShow = 1
   else
      bearEngulfShow = 0
   endif
   if bullishEngulfing and ltHisCHoCH = 1 and ltHMeasure = 0 and close < ltHZoneTop then
      bullEngulfShow = 1
   else
      bullEngulfShow = 0
   endif
elsif engulfMode = 1 then
   if bearishEngulfing then
      bearEngulfShow = 1
   else
      bearEngulfShow = 0
   endif
   if bullishEngulfing then
      bullEngulfShow = 1
   else
      bullEngulfShow = 0
   endif
else
   bearEngulfShow = 0
   bullEngulfShow = 0
endif
//------------------------------------------------
// Fibonacci Management - Bullish
//------------------------------------------------
if ltHisCHoCH = 1 and ltHMeasure = 1 then
   if low > ltHlwest then
      bullFibActive = 1
   else
      bullFibActive = 0
   endif
endif
//------------------------------------------------
// Fibonacci Management - Bearish
//------------------------------------------------
if ltLisCHoCH = 1 and ltLMeasure = 1 then
   if high < ltLhghst then
      bearFibActive = 1
   else
      bearFibActive = 0
   endif
endif
//------------------------------------------------
// Drawing Section - Only on last bar update
//------------------------------------------------
if islastbarupdate then
   //--- Bullish CHoCH Line and Label ---
   if bullChochActive and bullCHoCHs then
      drawsegment(bullChochX, bullChochY, bullChochRight, bullChochY) coloured("green") style(line)
      drawtext("CHoCH", (bullChochX + bullChochRight) / 2, bullChochY - atr * 0.3) coloured("green")
   endif
   //--- Bearish CHoCH Line and Label ---
   if bearChochActive and bearCHoCHs then
      drawsegment(bearChochX, bearChochY, bearChochRight, bearChochY) coloured("red") style(line)
      drawtext("CHoCH", (bearChochX + bearChochRight) / 2, bearChochY + atr * 0.3) coloured("red")
   endif

   //--- Bullish Fibonacci Levels ---
   if bullshow and bullFibActive and bullFibHighPrice > 0 and bullFibLowPrice > 0 then
      fibRange = abs(bullFibHighPrice - bullFibLowPrice)

      // Reference line (dashed)
      drawsegment(bullFibLowIndex, bullFibLowPrice, bullFibHighIndex, bullFibHighPrice) coloured("green") style(dottedline)

      // Level 1 (bottom of move)
      fib1Price = bullFibLowPrice
      drawsegment(bullFibLowIndex, fib1Price, n + 5, fib1Price) coloured("green") style(line)
      drawtext("100%", n + 8, fib1Price) coloured("green")

      // Level 0.786
      fib0786Price = bullFibHighPrice - fibRange * value0786
      drawsegment(bullFibHighIndex, fib0786Price, n + 5, fib0786Price) coloured("green") style(dottedline)
      drawtext("78.6%", n + 8, fib0786Price) coloured("green")

      // Level 0.618
      fib0618Price = bullFibHighPrice - fibRange * value0618
      drawsegment(bullFibHighIndex, fib0618Price, n + 5, fib0618Price) coloured("green") style(dottedline)
      drawtext("61.8%", n + 8, fib0618Price) coloured("green")

      // Level 0.5
      fib05Price = bullFibHighPrice - fibRange * value05
      drawsegment(bullFibHighIndex, fib05Price, n + 5, fib05Price) coloured("green") style(dottedline)
      drawtext("50%", n + 8, fib05Price) coloured("green")

      // Level 0.382
      fib0382Price = bullFibHighPrice - fibRange * value0382
      drawsegment(bullFibHighIndex, fib0382Price, n + 5, fib0382Price) coloured("green") style(dottedline)
      drawtext("38.2%", n + 8, fib0382Price) coloured("green")

      // Level 0.236
      fib0236Price = bullFibHighPrice - fibRange * value0236
      drawsegment(bullFibHighIndex, fib0236Price, n + 5, fib0236Price) coloured("green") style(dottedline)
      drawtext("23.6%", n + 8, fib0236Price) coloured("green")

      // Level 0 (top of move)
      fib0Price = bullFibHighPrice
      drawsegment(bullFibHighIndex, fib0Price, n + 5, fib0Price) coloured("green") style(line)
      drawtext("0%", n + 8, fib0Price) coloured("green")
   endif

   //--- Bearish Fibonacci Levels ---
   if bearshow and bearFibActive and bearFibHighPrice > 0 and bearFibLowPrice > 0 then
      fibRange = abs(bearFibHighPrice - bearFibLowPrice)

      // Reference line (dashed)
      drawsegment(bearFibHighIndex, bearFibHighPrice, bearFibLowIndex, bearFibLowPrice) coloured("red") style(dottedline)

      // Level 1 (top of move)
      fib1Price = bearFibHighPrice
      drawsegment(bearFibHighIndex, fib1Price, n + 5, fib1Price) coloured("red") style(line)
      drawtext("100%", n + 8, fib1Price) coloured("red")

      // Level 0.786
      fib0786Price = bearFibLowPrice + fibRange * value0786
      drawsegment(bearFibLowIndex, fib0786Price, n + 5, fib0786Price) coloured("red") style(dottedline)
      drawtext("78.6%", n + 8, fib0786Price) coloured("red")

      // Level 0.618
      fib0618Price = bearFibLowPrice + fibRange * value0618
      drawsegment(bearFibLowIndex, fib0618Price, n + 5, fib0618Price) coloured("red") style(dottedline)
      drawtext("61.8%", n + 8, fib0618Price) coloured("red")

      // Level 0.5
      fib05Price = bearFibLowPrice + fibRange * value05
      drawsegment(bearFibLowIndex, fib05Price, n + 5, fib05Price) coloured("red") style(dottedline)
      drawtext("50%", n + 8, fib05Price) coloured("red")

      // Level 0.382
      fib0382Price = bearFibLowPrice + fibRange * value0382
      drawsegment(bearFibLowIndex, fib0382Price, n + 5, fib0382Price) coloured("red") style(dottedline)
      drawtext("38.2%", n + 8, fib0382Price) coloured("red")

      // Level 0.236
      fib0236Price = bearFibLowPrice + fibRange * value0236
      drawsegment(bearFibLowIndex, fib0236Price, n + 5, fib0236Price) coloured("red") style(dottedline)
      drawtext("23.6%", n + 8, fib0236Price) coloured("red")

      // Level 0 (bottom of move)
      fib0Price = bearFibLowPrice
      drawsegment(bearFibLowIndex, fib0Price, n + 5, fib0Price) coloured("red") style(line)
      drawtext("0%", n + 8, fib0Price) coloured("red")
   endif

   //--- Engulfing Patterns ---
   if bearEngulfShow then
      drawtext("▼", n, high + atr * 0.3) coloured("red")
   endif

   if bullEngulfShow then
      drawtext("▲", n, low - atr * 0.3) coloured("green")
   endif

   //--- Strong/Weak High/Low Labels ---
   if showHLSwings then
      if ltMS > 0 then
         drawtext("Weak High", ltHLastIndex, ltHLastPrice + atr * 0.5) coloured("red")
         drawtext("Strong Low", ltLLastIndex, ltLLastPrice - atr * 0.5) coloured("green")
      else
         drawtext("Strong High", ltHLastIndex, ltHLastPrice + atr * 0.5) coloured("red")
         drawtext("Weak Low", ltLLastIndex, ltLLastPrice - atr * 0.5) coloured("green")
      endif
   endif
endif
//--------------------------------------------------------------------------------//
return
