

Fearzone indicator
June 18, 2018, 8:19 AM
Indicators
13 Comments
This indicator is created by some Swedish authors/traders and is available in their book “Framgangrik aktiehandel”.
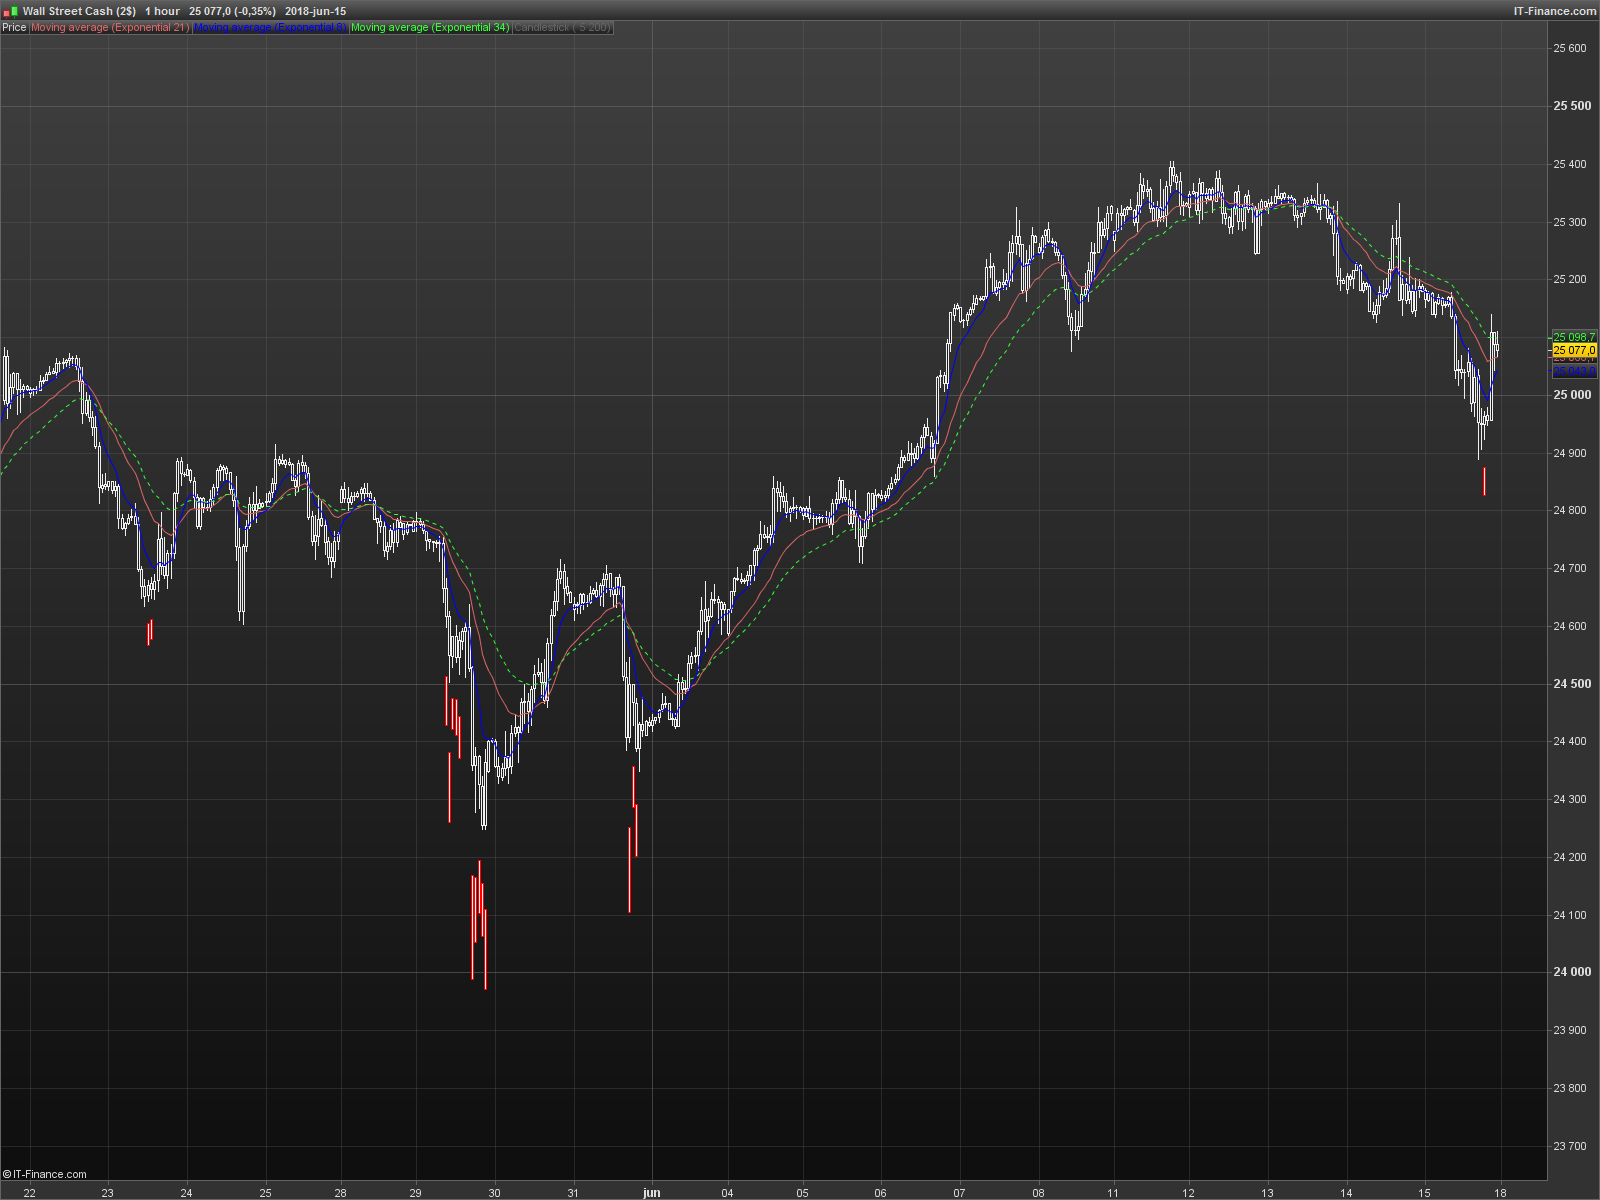
The indicator draws a candle underneath the price when two conditions are met indication that the market is in “fear mode”.
This could be a great opportunity since the market participants are not “rational” and that opportunities on the long side is possibly around the corner.
// FEARZONE

period = 30
periodavstd = 100

//First condition
FZ1 = (highest[period](totalprice) - totalprice)/highest[period](totalprice)
av1=average[periodAvStd](FZ1)
stdv1= STD[periodAvStd](FZ1)
FZ1Limit= av1+stdv1

// Second condition
FZ2 = average[period](totalprice)
av2=average[periodAvStd](FZ2)
stdv= STD[periodAvStd](FZ2)
FZ2Limit= av2-stdv

//In Fearzone?
if FZ1 > FZ1Limit and FZ2 < FZ2Limit Then
 drawcandle(low-range,low-range,low-2*range,low-2*range) coloured(255,255,255)
endif

return
You should adjust the two parameters to adjust the setting that fits best with the chart you are looking at.
Download
Filename:
FearZone-indicator.itf
Downloads:
421
Average
Developer by day, aspiring writer by night. Still compiling my bio... Error 404: presentation not found.
Author’s Profile
Loading...