

FCB - Fractal Chaos Bands
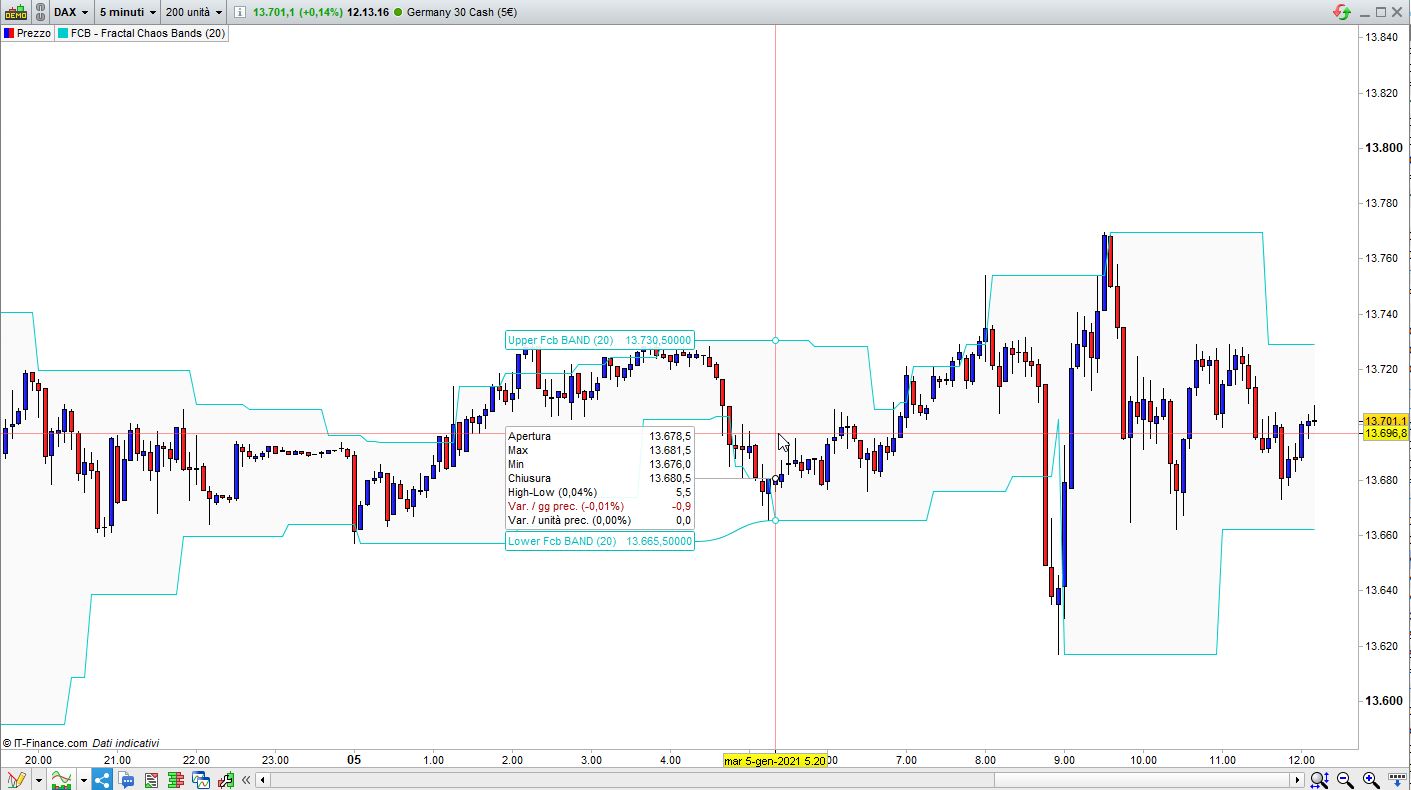
Fractal Chaos Band indicator helps us to identify whether the stock market is trending or not.
When a market is trending, the bands will have a slope. If market is not trending the bands will flatten out.
As the slope of the bands decreases, it signifies that the market is choppy, insecure and variable.
The graph becomes more and more abrupt, be it going up or down. The significance is that the market becomes trendy, or stable.
This indicator is used similarly to other bands-indicator offering trading opportunities when price
moves above or under the fractal lines.
The upper fractal line is made by plotting stock price highs and the lower fractal line is made by plotting stock price lows.
Essentially, the Fractal Chaos Bands show an overall panorama of the price movement. As they filter out the insignificant fluctuations of the stock price.
I coded this indicator following a request on the italian forum https://www.prorealcode.com/topic/fractal-chaos-band/.
// FCB - Fractal Chaos Bands
//
// https://aliceblueonline.com/market-talk/how-to-use-fractal-chaos-band/
//
//ONCE Periods = 20
ONCE HIfractal = high
ONCE LOfractal = low
Periods        = max(1,min(999,Periods))
//
HIfractal = high[1] > high[2] AND high[1] > high
LOfractal = low[1]  < low[2]  AND low[1]  < low
//
IF HIfractal THEN
   HIfractal = high[1]
ELSE
   HIfractal = HIfractal[1]
ENDIF
IF LOfractal THEN
   LOfractal = low[1]
ELSE
   LOfractal = LOfractal[1]
ENDIF
HIvalue   = highest[Periods](HIfractal)
LOvalue   = lowest[Periods](LOfractal)
RETURN HIvalue AS "Upper Fcb BAND",LOvalue AS "Lower Fcb BAND"
