

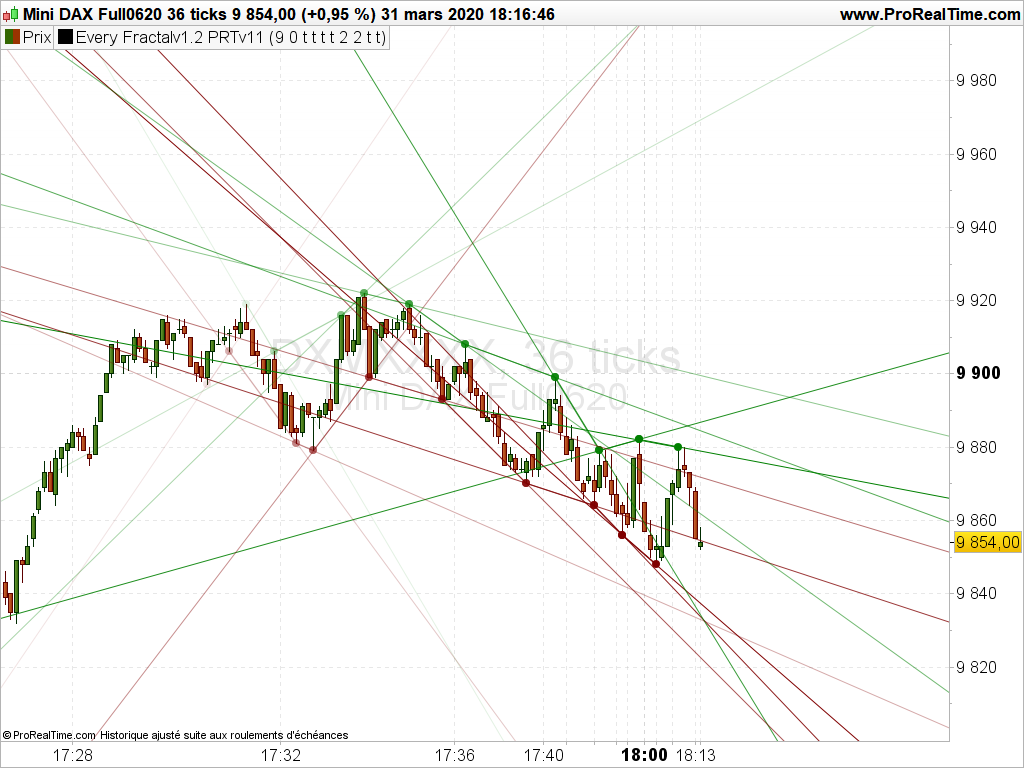
Every Fractal trend lines
This indicator only works on PRTv11.
This indicator allows you to draw lines connecting every possible pair of fractals or swing highs and swing lows on the chart.
A line connecting two fractals in a row can be drawn into the future and/or into the past by setting ‘Future’ and/or ‘Past’.
A point marking the highs and lows of the connecting fractals can be displayed or removed using the ‘Points’ setting.
The quantity of fractals displayed can be selected by changing the value of ‘Qty’.
The type of fractal recognised can be changed by adjusting the ‘BarsBefore and ‘BarsAfter’ values. For example a high fractal consisting of 3 bars before and 2 bars after would be a high with three previous lower highs preceding it and two lower highs after it.
‘StartBack’ allows you to choose to show just previous fractals. A setting of zero displays from the latest fractal back. A setting of 1 would ignore the latest fractal and display fractals from the second most recent fractal and so on.
Using the ‘Fade’ setting will mean that the older a fractal is the paler the line and point is.
The settings ‘Support’ and ‘Resistance’ allow you to turn off or on the display of the upper or lower fractal lines.
I advise downloading the ITF file and importing into your platform to get full functionality.
//Every Fractal
//PRT v11
//By Vonasi
//Date: 20200331

//Qty = 1
//StartBack = 0
//Past = 1
//Future = 1
//Points = 1
//Fade = 0
//BarsBefore = 1
//BarsAfter = 1

BarsBefore = max(BarsBefore,1)
BarsAfter = max(BarsAfter,1)
StartBack = max(0,startback)

BarLookBack  = BarsAfter + 1
if low[BarsAfter] < lowest[BarsBefore](low)[BarLookBack] THEN
if low[BarsAfter] = lowest[BarLookBack](low) THEN
a = a + 1
$supportbar[a] = barindex[barsafter]
$supportvalue[a] = low[barsafter]
endif
endif
if high[BarsAfter] > highest[BarsBefore](high)[BarLookBack] THEN
if high[BarsAfter] = highest[BarLookBack](high) THEN
b = b + 1
$resistancebar[b] = barindex[barsafter]
$resistancevalue[b] = high[barsafter]
endif
endif

if islastbarupdate then
for z = 0 to qty-1
e = (qty)-z
if fade then
c = (255/qty)*e
else
c = 255
endif
if support then
if a >= 2 then
if future then
drawray($supportbar[a-z-1-startback],$supportvalue[a-z-1-startback],$supportbar[a-z-startback],$supportvalue[a-z-startback])coloured(128,0,0,c)
endif
if past then
drawray($supportbar[a-z-startback],$supportvalue[a-z-startback],$supportbar[a-z-1-startback],$supportvalue[a-z-1-startback])coloured(128,0,0,c)
endif
if points then
drawpoint($supportbar[a-z-1-startback],$supportvalue[a-z-1-startback],2)coloured(128,0,0,c)
drawpoint($supportbar[a-z-startback],$supportvalue[a-z-startback],2)coloured(128,0,0,c)
endif
endif
endif

if resistance then
if b >= 2 then
if future then
drawray($resistancebar[b-z-1-startback],$resistancevalue[b-z-1-startback],$resistancebar[b-z-startback],$resistancevalue[b-z-startback])coloured(0,128,0,c)
endif
if past then
drawray($resistancebar[b-z-startback],$resistancevalue[b-z-startback],$resistancebar[b-z-1-startback],$resistancevalue[b-z-1-startback])coloured(0,128,0,c)
endif
if points then
drawpoint($resistancebar[b-z-1-startback],$resistancevalue[b-z-1-startback],2)coloured(0,128,0,c)
drawpoint($resistancebar[b-z-startback],$resistancevalue[b-z-startback],2)coloured(0,128,0,c)
endif
endif
endif
next
endif

return