

EMA Trend Meter Indicator
EMA Trend Meter: An Essential Indicator for Trend Detection
Introduction
The “EMA Trend Meter” can be an interesting tool to identify the direction and strength of a financial asset’s trend. In this article, we will explain the indicator in detail, from its setup to its interpretation.
Fundamentals of the EMA Trend Meter
The “EMA Trend Meter” is based on the Exponential Moving Average (EMA), which is a more sensitive version of the moving average that gives more weight to recent data. This indicator uses four EMAs of different periods (1, 7, 14, and 21 days) to detect the direction of the trend and its strength. These periods, as well as the type of averages, are adjustable, as we will see now.
Setup and Parameters
The indicator consists of several adjustable parameters:
- src: Defines the price source, usually the closing price.
- p0, p1, p2, p3: Represent the periods of the EMAs, set at 1, 7, 14, and 21, respectively.
- t0, t1, t2, t3: Types of moving averages, all initially set as exponential averages.
- n: Period used for the calculation of the Rate of Change (ROC).
- Additionally, parameters are incorporated to calculate the RSI and the Stochastic Oscillator, key elements to determine the strength of the trend.
Logic of the Indicator and Calculation
The EMAs are calculated on the selected price, adjusting the indicator’s sensitivity to price changes. The ROC of the EMAs offers a measure of the speed at which the trend changes. By combining the reading of the variation of the EMAs with that of the stochastic RSI, the “EMA Trend Meter” provides a comprehensive view of the direction and strength of trends.
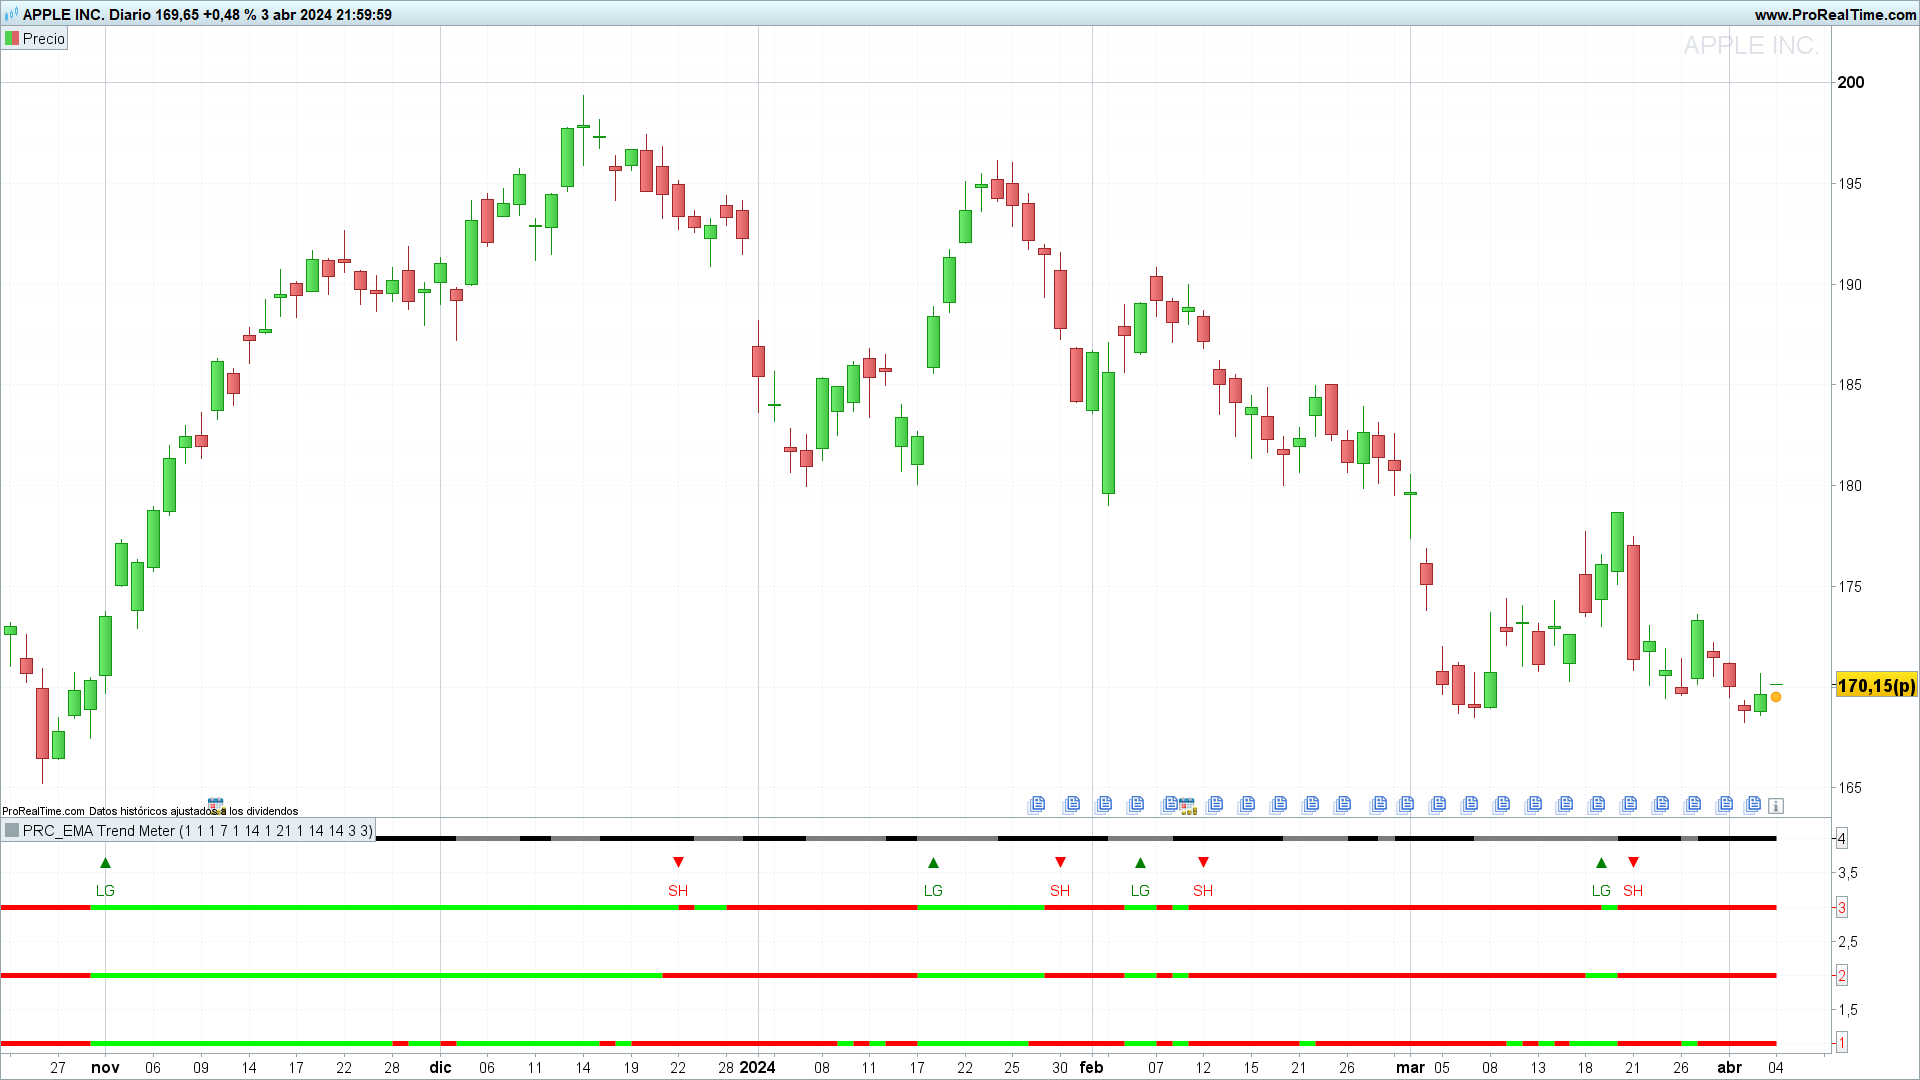
Interpretation of the Indicator
The interpretation focuses on the color of the EMA lines and the relative position of the Stochastic K and D. EMAs that change to green indicate an uptrend, while red suggests a downtrend. A Stochastic K above D reinforces the buy signal, and vice versa for the sell signal.
Trading Alerts
The indicator generates buy alerts when more than one EMA turns green and the Stochastic K is above D. Similarly, sell alerts are generated under opposite conditions. This is a way of combining signals from different indicators.
Conclusion
The “EMA Trend Meter” can be a powerful tool for traders looking to capture and analyze market trends accurately. Its ability to combine multiple indicators on a single chart makes it indispensable for future trading strategies.
Indicator Code in ProBuilder
Below is the code for the indicator in the ProBuilder language, designed to be easily integrated into the ProRealTime platform:
//PRC_EMA Trend Meter
//version = 0
//04.04.24
//Iván González @ www.prorealcode.com
//Sharing ProRealTime knowledge
//-----Inputs--------------------------------------------------//
src=customclose
p0=1//Periods Baseline moving average
t0=1//Type of moving average
p1=7//Periods moving average 1
t1=1//Type of moving average 1
p2=14//Periods moving average 2
t2=1//Type of moving average 2
p3=21//Periods moving average 3
t3=1//Type of moving average 3
n=1//Periods ROC calculation
rsiperiod = 14//RSI periods
Stolength = 14//Stochastic Length
SmoK=3//K periods
SmoD=3//D periods
ShowAlerts=1//Show long/short alerts
//-------------------------------------------------------------//
//-----EMAs Calculations---------------------------------------//
ema0 = average[p0,t0](src)
ema1 = average[p1,t1](ema0)
ema2 = average[p2,t2](ema0)
ema3 = average[p3,t3](ema0)
rocema1 = roc[n](ema1)
rocema2 = roc[n](ema2)
rocema3 = roc[n](ema3)
//-------------------------------------------------------------//
//-----Stochastic RSI Calculations----------------------------------------//
myRSI = rsi[rsiperiod](ema0)
minRSI = lowest[Stolength](myRSI)
maxRSI = highest[Stolength](myRSI)
StochRSI = (myRSI-MinRSI) / (MaxRSI-MinRSI)
Stok = average[SmoK](StochRSI)*100
StoD = average[SmoD](Stok)
//-------------------------------------------------------------//
//-----Trend meter configuration-------------------------------//
if rocema1>0 then
r01=0
g01=255
else
r01=255
g01=0
endif
if rocema2>0 then
r02=0
g02=255
else
r02=255
g02=0
endif
if rocema3>0 then
r03=0
g03=255
else
r03=255
g03=0
endif
if StoK>StoD then
r=124
g=124
b=124
else
r=0
g=0
b=0
endif
//-------------------------------------------------------------//
//-----Alert Conditions----------------------------------------//
if ShowAlerts and ((rocema1>0) + (rocema2 > 0) + (rocema3>0))>1 and stoK>StoD and not long then
long=1
drawtext("▲",barindex,3.65)coloured("green")
drawtext("LG",barindex,3.25)coloured("green")
elsif ShowAlerts and ((rocema1>0) + (rocema2 > 0) + (rocema3>0))<2 and stoK<StoD and long then
long=0
drawtext("▼",barindex,3.65)coloured("red")
drawtext("SH",barindex,3.25)coloured("red")
endif
//-------------------------------------------------------------//
return 1 as "ema1" coloured(r01,g01,0)style(line,5),2 as "ema2" coloured(r02,g02,0)style(line,5),3 as "ema3" coloured(r03,g03,0)style(line,5),4 as "RSI" coloured(r,g,b)style(line,5)
