

Elastic Weighted Moving Average Hi/Lo Bands
April 5, 2016, 5:42 PM
Indicators
6 Comments
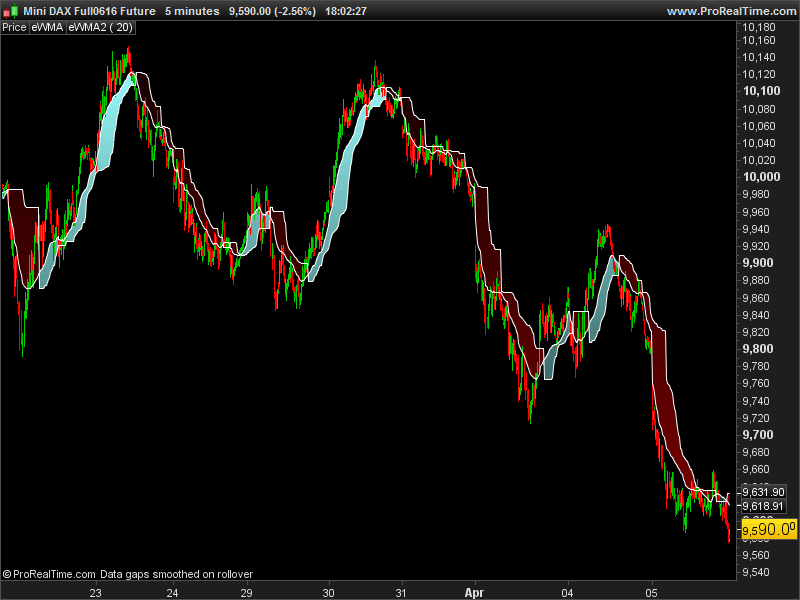
The eWMA is a moving average that use Volume to calculate its period. This moving average is a statistical measure of the Volume other time, which display nicely the price direction. Originally developped by Christian P. Fries, I added here a “kind of” band for buy/sell triggers or trend filtering purpose.
The band is made of the highest high or the lowest low of the eWMA. Trend direction change when the eWMA piercing its own value, back to N previous period.
This indicator needs instruments with Volume for calculation.
//parameters :
// period = 20
// lookback = 10

IF BarIndex < period THEN
 eVWMA = Close
ELSE
 N = Summation[period](Volume)
 eVWMA = ((N - Volume)*eVWMA + Volume*Close)/N
ENDIF

hh = highest[period](evWMA)
ll = lowest[period](evWMA)

if evWMA>hh[lookback] then
 trend = ll
elsif evWMA<ll[lookback] then
 trend = hh
endif

RETURN trend as "support resistance zone", evWMA as "elastic weigthed moving average"
Download
Filename:
eWMA-Bands.itf
Downloads:
186
Master
I created ProRealCode because I believe in the power of shared knowledge. I spend my time coding new tools and helping members solve complex problems.
If you are stuck on a code or need a fresh perspective on a strategy, I am always willing to help. Welcome to the community!
Author’s Profile
Loading...