

Ehler's Unique Correlation Trend Indicator CTI
John Ehlers, Correlation Trend Indicator, Stocks & Commodities Magazine (05/2020) :
“The basic idea of the Correlation Trend Indicator (CTI) is quite simple. The ideal trend curve is a straight upwards line. So the CTI just measures the correlation of the price curve with this ideal trend line.
X represents the price curve, Y the trend line, and correlation is measured with the Spearman algorithm. (As Nicolas pointed out it is in fact based on the R-squared correlation coefficient formula which is a statistical measure of how close data is fitted to a regression line).
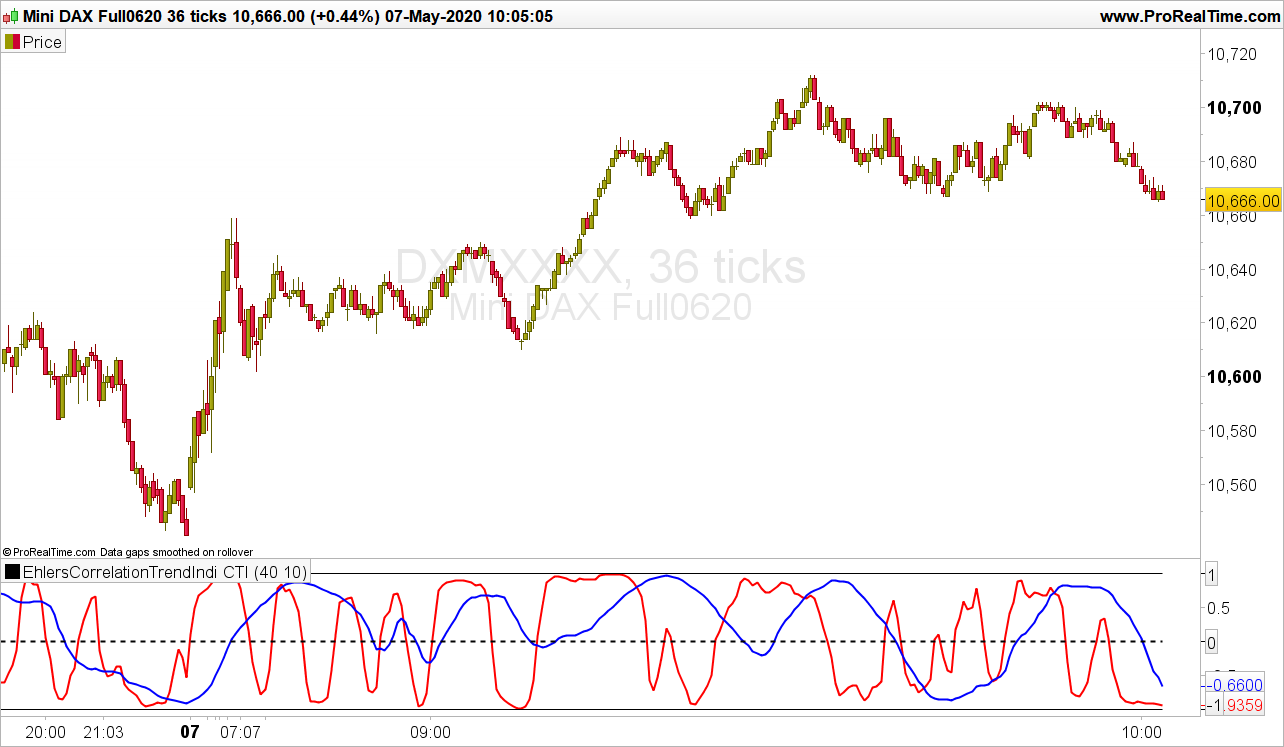
This is how the Correlation Trend Indicator (CTI) looks when applied to SPY (red = 10 days period, blue = 40 days).
We can see that the lines reproduce rather well the price curve trend. And we can also see that the blue line, the 40-days trend, is not just a smoothed version of the red 10-days trend – it looks entirely different. This is an interesting feature of a trend indicator – it separates long-term and short-term trend perfectly…”
The article goes on to mention that ‘trading on CTI crossovers would be difficult. A somewhat predictive power of the CTI(SPY,20) exists – but it is too weak for being directly exploited in a crossover trading system.'”
From my own analysis I’d be inclined to suggest that a relationship does exit that is not random. Please see the link below showing a system with a 5 and 10 day CTI crossover on mean reverting major currency pairs: https://www.prorealcode.com/topic/very-latest-ehlers-correlation-trend-indicator-2/#post-129552
The system ITF code is in the very next comment after the link above. If time allows I will apply Machine Learning code to the CTI periods and the crossover thresholds. The current CTI system buys when the 5 day CTI crosses over the 10 day CTO when both values are below -0.5 threshold and vice versa for the short entry. Exits are provided by the Kase Dev Stop (v3).
//Ehler's Correlation Trend Indicator (CTI)
//PRC_R-Squared coefficient | indicator
//19.09.2018
//Updated to double Ehler's R2 03/05/2020
//Nicolas @ www.prorealcode.com
//Sharing ProRealTime knowledge

// --- settings
LPeriod     =40 //Add in Variables
SPeriod     =10 //Add in Variables
// --- end of settings

//LPeriod=40
//SPeriod=10

///////////////////////////////////////////////////////////////////////////////////////////////////

//Short
SumSx = 0 // the price curve
SumSy = 0
SumSxx = 0
SumSxy = 0
SumSyy = 0 // the trend line

data=customclose

for count = 0 to SPeriod-1 do
X = Data[count] // the price curve
Y = -count // the trend line
SumSx = SumSx + X
SumSy = SumSy + Y
SumSxx = SumSxx + X*X
SumSxy = SumSxy + X*Y
SumSyy = SumSyy + Y*Y
next

if(SPeriod*SumSxx-SumSx*SumSx > 0 and SPeriod*SumSyy-SumSy*SumSy > 0) then
CTIShort = (SPeriod*SumSxy-SumSx*SumSy)/Sqrt((SPeriod*SumSxx-SumSx*SumSx)*(SPeriod*SumSyy-SumSy*SumSy))
endif

///////////////////////////////////////////////////////////////////////////////////////////////////

//Long
SumLx = 0
SumLy = 0
SumLxx = 0
SumLxy = 0
SumLyy = 0

for count = 0 to LPeriod-1 do
X = Data[count] // the price curve
Y = -count // the trend line
SumLx = SumLx + X
SumLy = SumLy + Y
SumLxx = SumLxx + X*X
SumLxy = SumLxy + X*Y
SumLyy = SumLyy + Y*Y
next

if(LPeriod*SumLxx-SumLx*SumLx > 0 and LPeriod*SumLyy-SumLy*SumLy > 0) then
CTILong = (LPeriod*SumLxy-SumLx*SumLy)/Sqrt((LPeriod*SumLxx-SumLx*SumLx)*(LPeriod*SumLyy-SumLy*SumLy))
endif

return CTIShort coloured (255,0,0) style (line,2) as "CTI Short R² Trend", CTILong coloured (0,0,255) style (line,2) as "CTI Long R² Trend", 0 style (dottedline,2)as "0", -1 as "-1", 1 as "1"