

Ehler's Fractal Adaptive Moving Average (FRAMA)
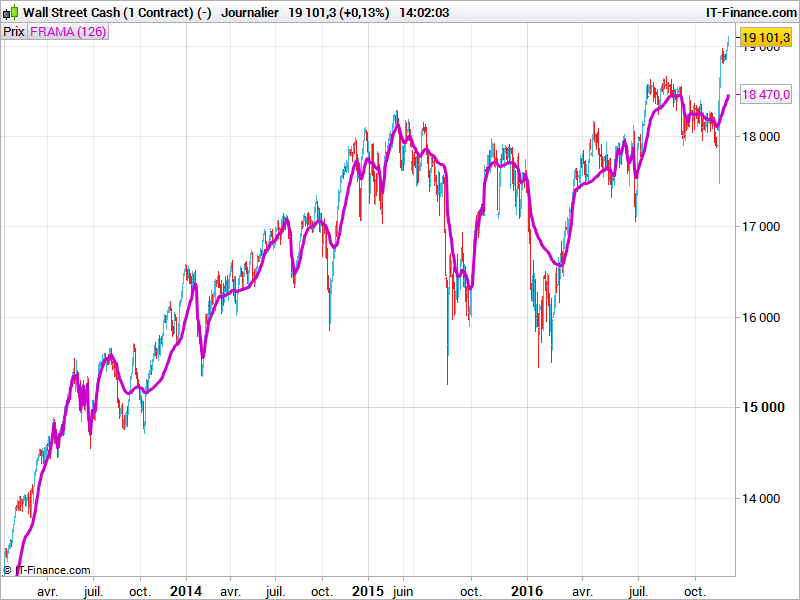
The Fractal Adaptive Moving Average FRAMA was developed by John Ehlers.
The indicator is constructed on the EMA exponential moving average algorithm, with a smoothing factor calculated on the basis of the current fractal dimension of the price.
The advantage of the indicator is the ability to track strong trend movements and market consolidation moments.
Interpretation Trading Signals And Rules:
The interpretation of the indicator is identical to the interpretation of moving averages
_ The FRAMA line is relatively “flat” in periods of horizontal range trading. It could therefore be used to avoid many false signals when it is desired to use a technique of the crossing of moving averages.
_ The FRAMA line has a greater reactivity to changes in trends than moving averages, making it possible to take a much earlier position on a breakout of the horizontal channel.
// FRAMA

//p = 20

pri=Customclose
len=p

N3=(Highest[len](High)-Lowest[len](Low))/len

mH=High
L=Low

For count=0 To len/2-1
 If High[count] > mH Then
  mH=High[count]
 Endif

 If Low[count] < L Then
  L=Low[count]
 Endif
Next

N1=(mH-L)/(len/2)

HH=High[len/2]
LL=Low[len/2]

For count=len/2 To len-1
 If High[count] > HH Then
  HH=High[count]
 Endif

 If Low[count] < LL Then
  LL=Low[count]
 Endif
Next

N2=(HH-LL)/(len/2)

If N1 > 0 And N2 > 0 And N3 > 0 Then
 Dimen=(Log(N1+N2)-Log(N3))/Log(2)
Endif

alpha=Exp(-4.6*(Dimen-1))

If alpha < 0.01 Then
 alpha=0.01
Endif

If alpha > 1 Then
 alpha=1
Endif

Filt=alpha*pri+(1-alpha)*Filt[1]

If Barindex < len+1 Then
 Filt=pri
Endif

Return Filt as "FRAMA"
original code from gigi @ http://www.aktienboard.com/forum/f29/prorealtime-cmc-script-programmierung-t94783/215#post2035965