

Echo Forecast: Projecting Future Price Action
Introduction
History doesn’t repeat itself, but it often rhymes. The Echo Forecast is an advanced predictive indicator designed (by Luxalgo) to find those “rhymes” in the market.
Instead of relying on lagging moving averages or standard oscillators, this indicator scans historical price action to find a pattern that closely matches the most recent market movements. Once it finds the most statistically similar historical pattern (the “echo”), it projects what happened after that historical event into the future, giving you a predictive roadmap of potential price action.
How It Works
At its core, the Echo Forecast relies on the Pearson Correlation Coefficient. Here is the step-by-step logic it performs on your chart in real-time:
- The Reference Window: It takes the most recent block of price action (e.g., the last 50 bars).
- The Evaluation Scan: It looks backward through a defined historical window (e.g., the previous 200 bars).
- The Match: It compares the shape of the recent price action against every possible historical block of the same size to find the highest correlation.
- The Projection: Once the best historical match is found, the indicator looks at the price action that immediately followed that historical match and plots it forward from the current price.
Understanding the Visuals
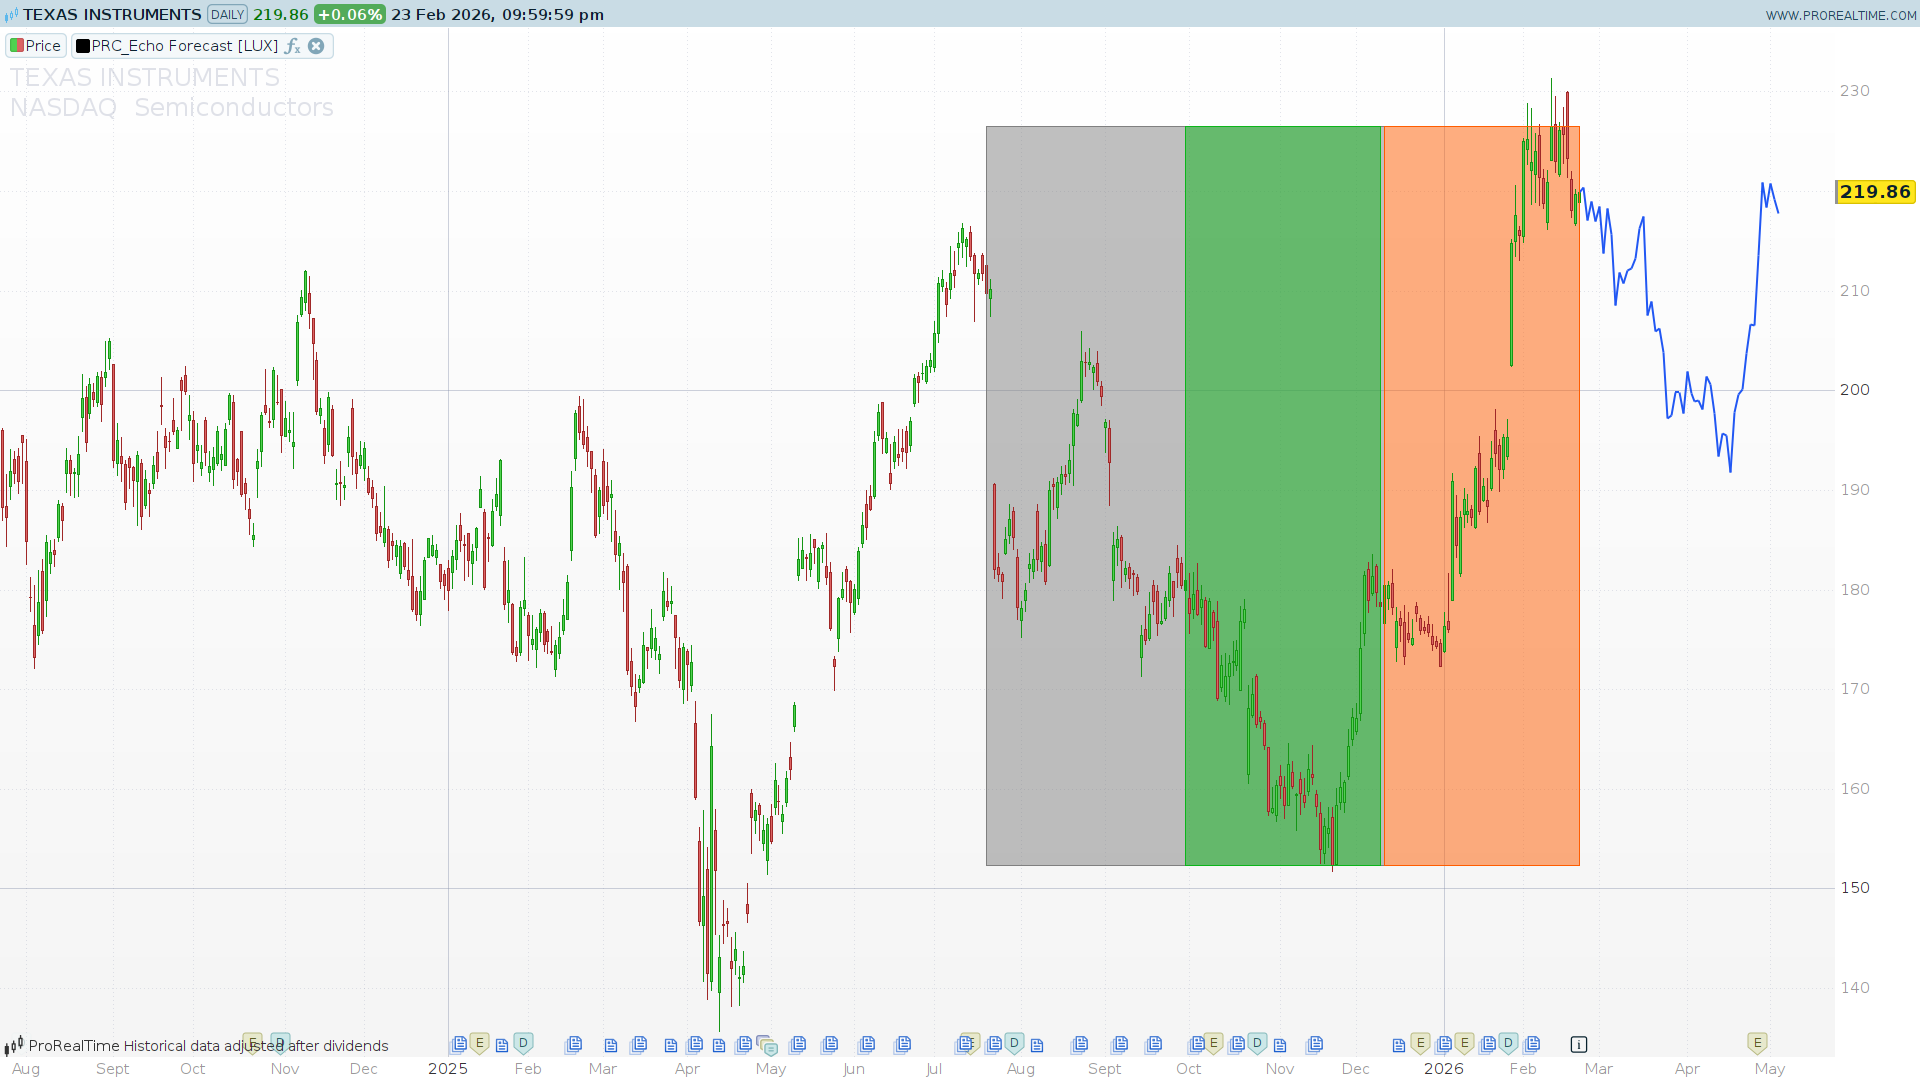
When you apply the indicator to your chart, you will see colored areas and a projected line. Here is how to read them:
- Orange Area (Recent Reference): This highlights the most recent price action that the algorithm is trying to find a match for.
- Gray Area (Evaluation Zone): This is the historical “search area” where the indicator looked for a matching pattern.
- Green Area (The Match): This highlights the historical price action that has the highest mathematical correlation to the Orange Area.
- Blue Line (The Forecast): This is the future projection, plotted by mirroring what happened immediately after the Green Area.
Configuration & Parameters
The indicator is highly customizable. You can adjust the following variables at the beginning of the code to fit your trading style and timeframe:
myLength(Evaluation Window): Default = 50. This defines how far back in time the indicator will search to find a match. A larger number gives the algorithm more history to scan but may require more processing power.myFcast(Forecast Window): Default = 50. This sets the size of the pattern you are trying to match (e.g., a 50-bar pattern) and simultaneously dictates how far into the future the projection line will be drawn.fmode(Forecast Mode): *0 = Similarity: Finds the exact same pattern (Positive correlation).1 = Dissimilarity: Finds the exact opposite pattern (Negative/Inverse correlation). Useful for finding mean-reversion setups.cmode(Calculation Mode): Dictates how the forecasted line is anchored to the current price.0 = Cumulative: Accumulates historical price changes directly from the current closing price.1 = Mean: Anchors the forecast to the average price of the recent window.2 = Linreg: Uses Linear Regression to project the trend, blending it with the historical changes.showArea: Default = 1. Set to1to display the colored background rectangles, or0to hide them for a cleaner chart (showing only the forecast line).
ProBuilder Code
//---------------------------------------------------------------//
// PRC_Echo Forecast [LUX] (by LuxAlgo)
// version = 0
// 20.02.2026
// Iván González @ www.prorealcode.com
// Sharing ProRealTime knowledge
//---------------------------------------------------------------//
defparam drawonlastbaronly = true
//---------------------------------------------------------------//
// === PARAMETERS ===
//---------------------------------------------------------------//
myLength = 50       // Evaluation Window (1 to 200)
myFcast  = 50       // Forecast Window (1 to 200)
fmode    = 0        // 0=Similarity, 1=Dissimilarity
cmode    = 0        // 0=Cumulative, 1=Mean, 2=Linreg
showArea = 1        // 1=show background areas, 0=hide
src      = customclose
//---------------------------------------------------------------//
// === FORECAST LINE COLOR (RGB) ===
//---------------------------------------------------------------//
fcR = 33
fcG = 87
fcB = 243
//---------------------------------------------------------------//
// === AREA COLORS (RGB) ===
//---------------------------------------------------------------//
// Evaluation area (gray)
eaR = 128
eaG = 128
eaB = 128
// Recent/Forecast reference area (orange)
faR = 255
faG = 93
faB = 0
// Best correlation area (green)
caR = 12
caG = 181
caB = 26
// Area transparency (0=transparent, 255=opaque) ~50% = 127
areaAlpha = 127
//---------------------------------------------------------------//
// === PRECALCULATIONS (every bar) ===
//---------------------------------------------------------------//
dd = src - src[1]
totalPeriod = myLength + myFcast * 2

topVal = highest[totalPeriod](src)
btmVal = lowest[totalPeriod](src)
//---------------------------------------------------------------//
// === MAIN LOGIC (last bar only) ===
//---------------------------------------------------------------//
if islastbarupdate and barindex > totalPeriod then

   // -------------------------------------------//
   // STEP 1: Store historical prices in array
   // -------------------------------------------//
   totalBars = myFcast * 2 + myLength
   for i = 0 to totalBars do
      $srcArr[i] = src[i]
   next

   // Store barindex values for Linreg mode
   if cmode = 2 then
      for i = 0 to totalBars do
         $xArr[i] = barindex - i
      next
   endif

   // -------------------------------------------//
   // STEP 2: Statistics of recent window (slice a)
   // -------------------------------------------//
   sz = myFcast - 1

   // Mean of a
   sumA = 0
   for j = 0 to sz - 1 do
      sumA = sumA + $srcArr[j]
   next
   meanA = sumA / sz

   // Standard deviation of a
   ssA = 0
   for j = 0 to sz - 1 do
      devA = $srcArr[j] - meanA
      ssA = ssA + devA * devA
   next
   stdA = sqrt(ssA / sz)

   // -------------------------------------------//
   // STEP 3: Find best matching historical window
   // -------------------------------------------//
   bestCorr = undefined
   bestK = 0

   for i = 0 to myLength - 1 do
      // Slice b: starts at (myFcast + i), same size as a
      sB = myFcast + i

      // Mean of b
      sumB = 0
      for j = 0 to sz - 1 do
         sumB = sumB + $srcArr[sB + j]
      next
      meanB = sumB / sz

      // Standard deviation of b
      ssB = 0
      for j = 0 to sz - 1 do
         devB = $srcArr[sB + j] - meanB
         ssB = ssB + devB * devB
      next
      stdB = sqrt(ssB / sz)

      // Covariance(a, b)
      covAB = 0
      for j = 0 to sz - 1 do
         covAB = covAB + ($srcArr[j] - meanA) * ($srcArr[sB + j] - meanB)
      next
      covAB = covAB / sz

      // Pearson correlation
      denom = stdA * stdB
      if denom > 0 then
         corrVal = covAB / denom
      else
         corrVal = 0
      endif

      // Track best match
      if fmode = 0 then
         // Similarity: keep highest correlation
         if bestCorr = undefined then
            bestCorr = corrVal
            bestK = i
         elsif corrVal >= bestCorr then
            bestCorr = corrVal
            bestK = i
         endif
      else
         // Dissimilarity: keep lowest correlation
         if bestCorr = undefined then
            bestCorr = corrVal
            bestK = i
         elsif corrVal <= bestCorr then
            bestCorr = corrVal
            bestK = i
         endif
      endif
   next

   // -------------------------------------------//
   // STEP 4: Linreg precalculation (if needed)
   // -------------------------------------------//
   alphaLR = 0
   betaLR = 0

   if cmode = 2 then
      sumALR = 0
      sumXLR = 0
      for j = 0 to myFcast - 1 do
         sumALR = sumALR + $srcArr[j]
         sumXLR = sumXLR + $xArr[j]
      next
      meanALR = sumALR / myFcast
      meanXLR = sumXLR / myFcast

      covAX = 0
      varXX = 0
      for j = 0 to myFcast - 1 do
         covAX = covAX + ($srcArr[j] - meanALR) * ($xArr[j] - meanXLR)
         varXX = varXX + ($xArr[j] - meanXLR) * ($xArr[j] - meanXLR)
      next
      covAX = covAX / myFcast
      varXX = varXX / myFcast

      if varXX <> 0 then
         alphaLR = covAX / varXX
      endif
      betaLR = meanALR - alphaLR * meanXLR
   endif

   // -------------------------------------------//
   // STEP 5: Generate forecast and draw segments
   // -------------------------------------------//
   prevP = src
   currP = src

   for i = 0 to myFcast - 1 do
      // Historical change from the best matching window
      eIdx = myFcast + bestK + (myFcast - i - 1)
      e = dd[eIdx]

      if cmode = 1 then
         // Mean mode: average of recent window + historical change
         currP = meanA + e
      elsif cmode = 2 then
         // Linreg mode: regression projection + historical change
         currP = alphaLR * (barindex + i + 1) + betaLR + e
      else
         // Cumulative mode: accumulate changes from current price
         currP = currP + e
      endif

      // Draw forecast segment
      drawsegment(barindex + i, prevP, barindex + i + 1, currP) coloured(fcR, fcG, fcB) style(line, 2)

      prevP = currP
   next

   // -------------------------------------------//
   // STEP 6: Draw background areas
   // -------------------------------------------//
   if showArea = 1 then
      // Evaluation area (gray) - full evaluation zone
      drawrectangle(barindex - totalPeriod + 1, btmVal, barindex - myFcast + 1, topVal) coloured(eaR, eaG, eaB) fillcolor(eaR, eaG, eaB, areaAlpha)

      // Recent window area (orange) - the reference window
      drawrectangle(barindex - myFcast + 1, btmVal, barindex, topVal) coloured(faR, faG, faB) fillcolor(faR, faG, faB, areaAlpha)

      // Best correlation area (green) - the matched window
      drawrectangle(barindex - bestK - myFcast * 2 + 1, btmVal, barindex - bestK - myFcast, topVal) coloured(caR, caG, caB) fillcolor(caR, caG, caB, areaAlpha)
   endif

endif
//---------------------------------------------------------------//
return
