

Echo Chamber: Pattern Projection Indicator
1. Introduction: The Concept of Market Echoes
In the world of technical analysis, there is a long-standing belief that financial markets are fractal and that “history repeats itself.” The Echo Chamber indicator, created by theUltimator5, is designed to exploit this phenomenon by scanning historical data to find the “closest match” to current price action.
Instead of relying on traditional lagging indicators, Echo Chamber uses mathematical correlation to identify a past sequence that mirrors the present. Once a match is found, it projects that historical “after-math” into the future, providing a roadmap of what might happen next based on historical precedent.
2. How it Works: The Statistics Behind the “Echo”
The core of this indicator is the Pearson Correlation Coefficient ($r$). The algorithm follows a rigorous step-by-step process:
- Sequence Collection: It captures the most recent price bars (the “Current Sequence”).
- Historical Scan: It iterates through a defined lookback period, comparing the current sequence against every possible historical segment of the same length.
- Correlation Matching: It calculates the correlation between the current sequence and historical segments. A value of 100% would indicate a perfect identical match.
- Scaling and Projection: Once the best match is identified, the indicator scales the historical price movements to match current volatility and projects the subsequent historical bars forward in time.
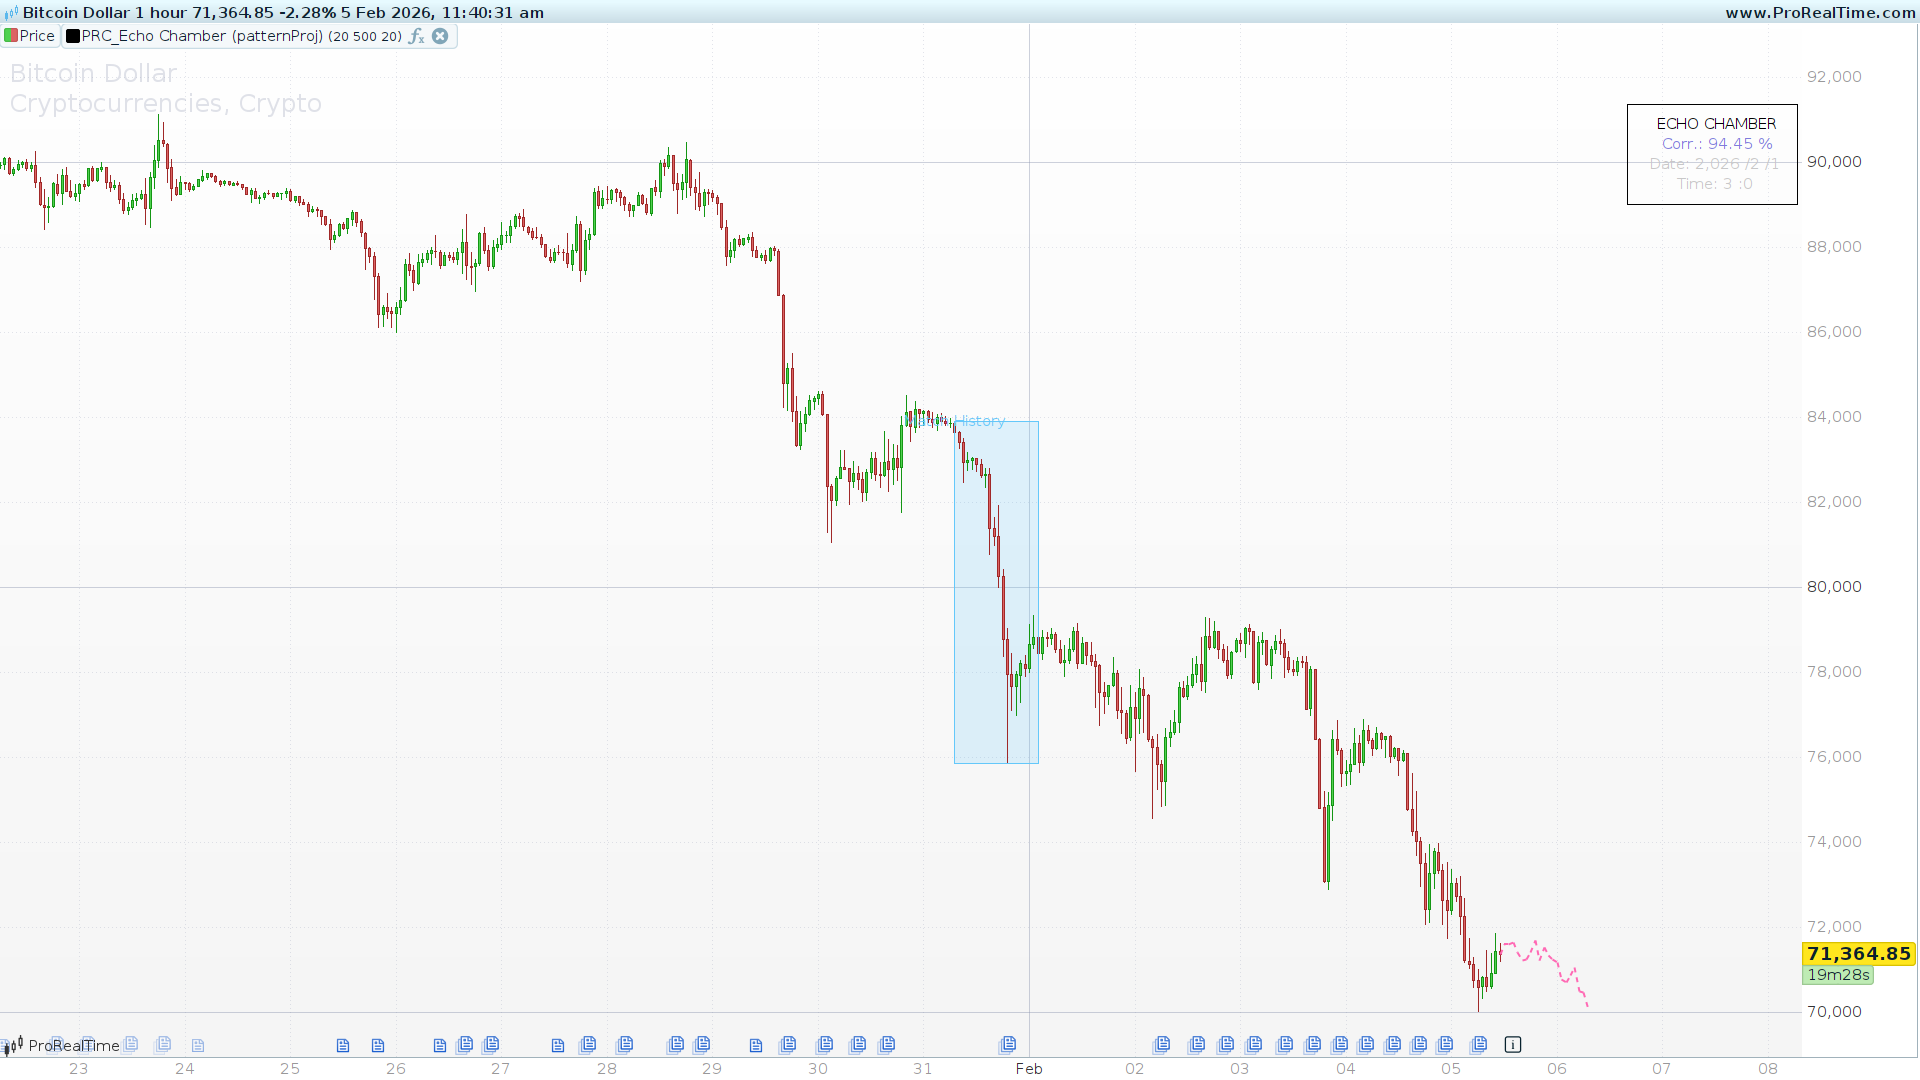
3. Visual Interpretation
The indicator provides three distinct visual cues on your ProRealTime chart:
- Match History Box: A blue-shaded rectangle will appear in the past, highlighting exactly which historical period the indicator has chosen as the best match.
- Future Projection: A dotted pink line extends from the current price into the empty space on the right of the chart. This represents the “Echo”—how price moved in the past after the matched pattern occurred.
- Information Panel: A floating dashboard (top right) displays:
- Correlation %: How closely the historical match mirrors the current pattern.
- Date/Time: Exactly when the historical match took place.
4. Settings & Customization
You can fine-tune the “Echo” through the following parameters:
- Length: 20. The number of recent bars used to define the current pattern.
- Lookback: 500. How many bars into the past the indicator will search for a match.
- ProjectionLen: 20. The number of bars to project into the future.
Pro Tip: If the Correlation % is low (e.g., below 70%), the projection should be treated with caution as the historical “match” is not statistically strong.
5. ProBuilder Code
// ---------------------------------------------------------
// PRC_Echo Chamber (Pattern Projection) [theUltimator5]
// version = 0
// 04.12.2025
// Iván González @ www.prorealcode.com
// Sharing ProRealTime knowledge
// ---------------------------------------------------------
DEFPARAM DrawOnLastBarOnly = True
// --- PARAMETERS ---
// Length: Correlation window (bars to compare)
Length = 20
// Lookback: How many bars to look back in history
Lookback = 500
// ProjectionLen: How many bars to project into the future
ProjectionLen = 20
// --- INTERNAL VARIABLES ---
bestCorrelation = -1.0
bestIndex = 0
currentScale = 0.0
historyScale = 0.0
// Execute only on the last bar to optimize resources
IF islastbarupdate THEN
   // 1. GET CURRENT SEQUENCE
   // Fill an array with recent close prices
   $currentSeq[0] = 0
   SumX = 0.0
   SumX2 = 0.0

   FOR i = 0 TO Length - 1 DO
      val = Close[i]
      $currentSeq[i] = val

      // Prepare data for correlation (X = Current Sequence)
      SumX = SumX + val
      SumX2 = SumX2 + (val * val)
   NEXT

   MeanX = SumX / Length
   StDevX = SQRT((SumX2 / Length) - (MeanX * MeanX))
   // 2. PATTERN SEARCH
   // Iterate backwards in history to find the best match
   // Start after the current window to avoid self-comparison
   StartIndex = Length + ProjectionLen
   EndIndex = Lookback

   FOR k = StartIndex TO EndIndex DO

      SumY = 0.0
      SumY2 = 0.0
      SumXY = 0.0

      // Collect historical segment (Y)
      FOR j = 0 TO Length - 1 DO
         histVal = Close[k + j]
         currVal = $currentSeq[j] // Note: currentSeq[0] is current Close

         SumY = SumY + histVal
         SumY2 = SumY2 + (histVal * histVal)
         SumXY = SumXY + (currVal * histVal)
      NEXT

      // Calculate Pearson Correlation r
      MeanY = SumY / Length
      StDevY = SQRT((SumY2 / Length) - (MeanY * MeanY))

      // Avoid division by zero if price is flat
      IF (StDevX * StDevY) <> 0 THEN
         Covariance = (SumXY / Length) - (MeanX * MeanY)
         Correlation = Covariance / (StDevX * StDevY)
      ELSE
         Correlation = 0
      ENDIF

      // Save best result
      IF Correlation > bestCorrelation THEN
         bestCorrelation = Correlation
         bestIndex = k
      ENDIF
   NEXT
   // 4. DRAW RESULTS
   IF bestIndex > 0 THEN

      // A) Highlight found historical segment
      // Calculate range to draw the box
      maxH = High[bestIndex]
      minL = Low[bestIndex]

      FOR j = 0 TO Length - 1 DO
         maxH = MAX(maxH, High[bestIndex + j])
         minL = MIN(minL, Low[bestIndex + j])
      NEXT

      // Draw rectangle in the past
      x1 = BarIndex - bestIndex - Length + 1
      x2 = BarIndex - bestIndex

      DRAWRECTANGLE(x1, maxH, x2, minL) COLOURED(100, 200, 250, 50) BORDERCOLOR(100, 200, 250)
      DRAWTEXT("Match History", x1, maxH) ANCHOR(BOTTOM, INDEX, VALUE) COLOURED(100, 200, 250)

      // B) Future Projection
      // Scale historical price to current price
      // Scale factor based on ranges (High - Low of the period)

      rangeHist = maxH - minL
      rangeCurr = Highest[Length](High) - Lowest[Length](Low)

      IF rangeHist <> 0 THEN
         scaleFactor = rangeCurr / rangeHist
      ELSE
         scaleFactor = 1
      ENDIF

      // Anchor point (last close)
      anchorPrice = Close[0]
      histAnchor = Close[bestIndex]

      // Draw projection line by line
      FOR m = 1 TO ProjectionLen DO

         // bestIndex is the end of the pattern. The future is at bestIndex - m
         idxFuture = bestIndex - m

         // Stop if index is out of bounds (negative index)
         IF idxFuture < 0 THEN
            BREAK
         ENDIF

         priceHistFuture = Close[idxFuture]
         priceHistPrev = Close[idxFuture + 1]

         // Price transformation: Adjustment by scale and anchor
         // Projecting the variation

         price1raw = Close[bestIndex - (m - 1)]
         price2raw = Close[bestIndex - m]

         // Transform
         val1 = anchorPrice + (price1raw - histAnchor) * scaleFactor
         val2 = anchorPrice + (price2raw - histAnchor) * scaleFactor

         // X Coordinates (Future)
         xStart = BarIndex + m - 1
         xEnd = BarIndex + m

         DRAWSEGMENT(xStart, val1, xEnd, val2) COLOURED(255, 105, 180) STYLE(dottedline, 2)
      NEXT
      // 5. INFORMATION PANEL
      txtCorr = round(bestCorrelation * 100, 2)
      txtDateYear = year[bestIndex]
      txtDateMonth = month[bestIndex]
      txtDateDay = day[bestIndex]
      txtTimehour = hour[bestIndex]
      txtTimeminute = minute[bestIndex]

      if gettimeframe<86400 then
         DRAWTEXT("ECHO CHAMBER", -200, -100) ANCHOR(TOPRIGHT, XSHIFT, YSHIFT) COLOURED(0, 0, 0)
         DRAWTEXT("Corr.: #txtCorr#%", -200, -120) ANCHOR(TOPRIGHT, XSHIFT, YSHIFT) COLOURED(125, 125, 220)
         DRAWTEXT("Date: #txtDateYear#/#txtDateMonth#/#txtDateDay#", -200, -140) ANCHOR(TOPRIGHT, XSHIFT, YSHIFT) COLOURED(200, 200, 200)
         DRAWTEXT("Time: #txtTimehour#:#txtTimeminute#", -200, -160) ANCHOR(TOPRIGHT, XSHIFT, YSHIFT) COLOURED(200, 200, 200)
         drawrectangle(-290, -80, -120, -180)ANCHOR(TOPRIGHT, XSHIFT, YSHIFT)
      else
         DRAWTEXT("ECHO CHAMBER", -200, -100) ANCHOR(TOPRIGHT, XSHIFT, YSHIFT) COLOURED(0, 0, 0)
         DRAWTEXT("Corr.: #txtCorr#%", -200, -120) ANCHOR(TOPRIGHT, XSHIFT, YSHIFT) COLOURED(125, 125, 220)
         DRAWTEXT("Date: #txtDateYear#/#txtDateMonth#/#txtDateDay#", -200, -140) ANCHOR(TOPRIGHT, XSHIFT, YSHIFT) COLOURED(200, 200, 200)
         drawrectangle(-290, -80, -120, -160)ANCHOR(TOPRIGHT, XSHIFT, YSHIFT)
      endif
   ENDIF
ENDIF

RETURN
