

Dynamic Zone Stoch RSI
February 17, 2017, 10:13 AM
Indicators
2 Comments
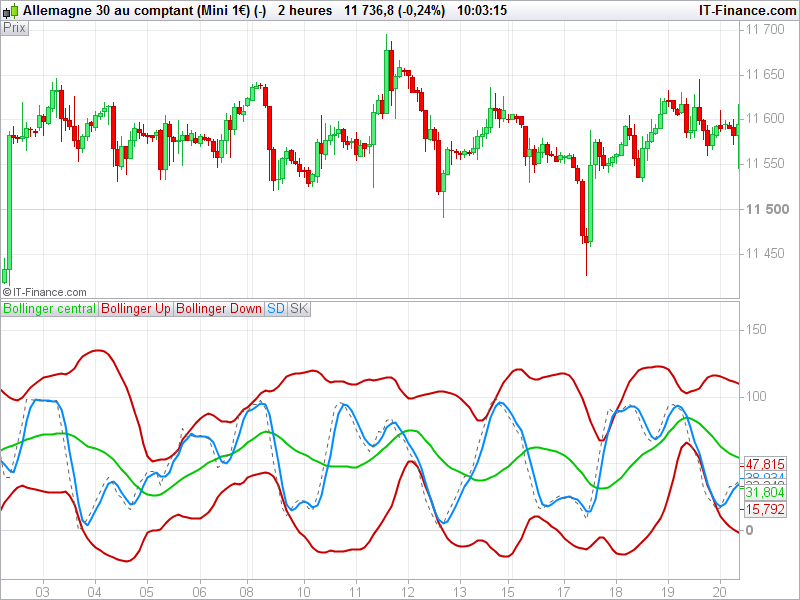
This indicator make stochastic calculation of a RSI indicator over the last X periods (RSI and stochastic periods can be modified in the first line of code).
By adding Bollinger bands of 2 standard deviations of the “Stoch RSI” curve, dynamic zones of overbought and oversold areas are displayed.
This code has been translated from LUA programming language, original indicator from fxcodebase.
//PRC_Dynamic Zone StochRSI | indicator
//17.02.2017
//Nicolas @ www.prorealcode.com
//Sharing ProRealTime knowledge
//converted from LUA (TS2) version

// --- parameters
N=14 //Number of periods for RSI
K=14 //%K Stochastic Periods
KS=5 //%K Slowing Periods
D=3 //%D Slowing Stochastic Periods

//Bollinger Band Calculation
Period=20
Dev=2.0 //Number of standard deviations
// --- end of parameters

rrsi = rsi[N]
maxrsi = highest[K-1](rrsi)
minrsi = lowest[K-1](rrsi)

if maxrsi=minrsi then
 ski = 100
else
 ski = (rrsi-minrsi)/(maxrsi-minrsi)*100
endif

SK = average[KS](ski)
SD = average[D](SK)

BB = average[Period](SK)
BBup = BB+std[Period](sk)*dev
BBdn = BB-std[Period](sk)*dev

RETURN BB coloured(0,200,0) style(line,2)  as "Bollinger central", BBup coloured(200,0,0) style(line,2) as "Bollinger Up", BBdn coloured(200,0,0) style(line,2) as "Bollinger Down", SD coloured(0,140,255) style(line,2) as "SD", SK coloured(100,100,100) style(dottedline,1) as "SK"
Download
Filename:
PRC_Dynamic-Zone-StochRSI.itf
Downloads:
232
Legend
I created ProRealCode because I believe in the power of shared knowledge. I spend my time coding new tools and helping members solve complex problems.
If you are stuck on a code or need a fresh perspective on a strategy, I am always willing to help. Welcome to the community!
Author’s Profile
Loading...