

Dynamic Zone Elasticity
Dynamic Zone Elasticity indicator is an oscillator to predict short term direction. It is best used for scalping or automated trading. It comprises a signal line and dynamic lower and upper zones, as well as a mid-level.
Screenshots:
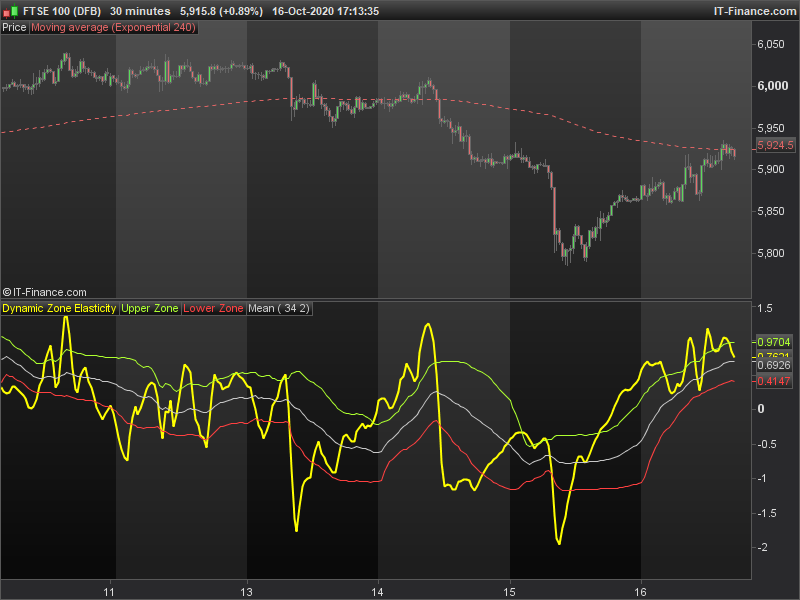
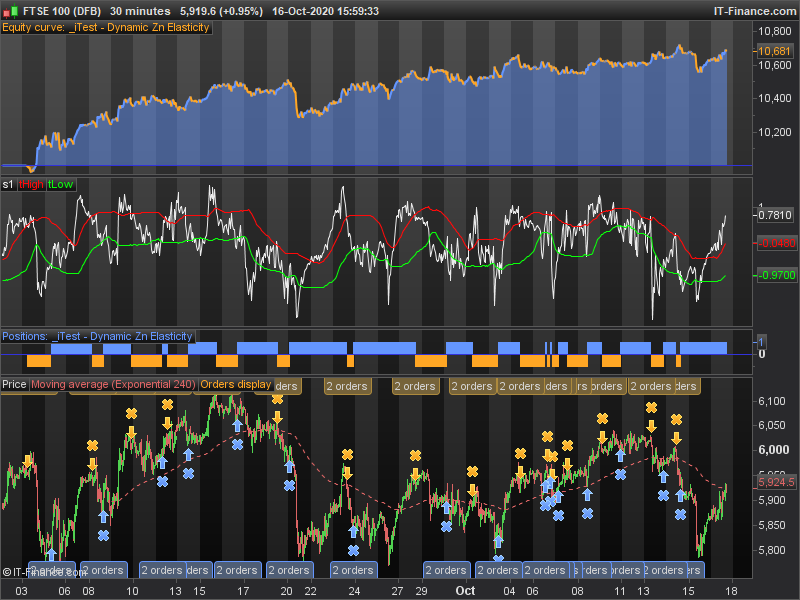
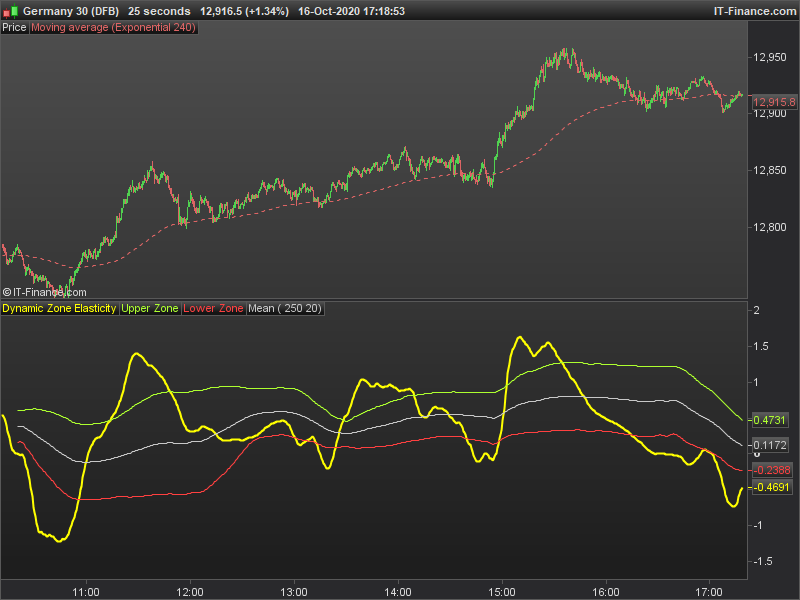
There are three screen shots attached with this indicator: Two are showing very different indicator settings on different markets, and a third screen shot shows an indicator test. The indicator test is not a trading strategy – it is simply a back-test placing a long and short at every (typical) buy and sell signal, being in the market 100% of the time. An indicator an be considered potentially useful if taking every signal generates a better return than the underlying market.
Parameters:
- Period – the number of candles to look back on, this adjusts the “speed” of the indicator.
- Smoothing – Reduces signal noise, adding delay
Interpretation:
Short term trading signals are generated when the signal line crosses through the various zone lines. A rising signal-line implies an upward continuation in price whilst a falling signal-line implies a downward continuation.
Typical interpretation would be as follows: A buy-signal may be generated as the signal line crosses above the lower zone, with a sell-signal generated as the signal line crosses below the upper zone. There are no strict rules dictating which zone crosses generate a signal – the user should derive their own conclusion based on the chosen market and indicator parameters.
The indicator can be used with a wide range of values to give different types of signals. Further filters can be derived by taking note of the hemisphere (position from zero) and direction of the zone lines, with respect to the signal line.
Credits
Author: Maz @ PRC
Release date: 16th October 2020
Inspiration: This study is inspired by “Elasticity of price” indicator, as first published by Nicolas of PRC, here: https://www.prorealcode.com/prorealtime-indicators/elasticity-of-price/
Thank you Nicolas for the original version.
Further research
Automated strategies can be derived from this study, particularly in conjunction with other indicators or filters. I hope this is helpful and welcome any discussion on subsequent strategies.
Period = 20
smoothing = 2
// ----------------

once smoothing = max(1, smoothing+1)
once period = max(1, Period)

// Coeficient, change if required
once coef = 0.8

// Signal line
x = std[Period](close)
signam = 1 + (-1* ( ((average[period](close) + (x*2)) - close) / x ) / 2)

// Dynamic Zones
sq    = square(signam)
mean  = average[period](signam)
vsqrt = sqrt( average[period](sq) - square(mean) )

top = mean + coef * vsqrt
btm = mean - coef * vsqrt

result = average[smoothing](signam)

return result coloured(255,255,0) style(line, 2) AS "Dynamic Zone Elasticity", top coloured(173,255,47) AS "Upper Zone", btm coloured(255,64,64) AS "Lower Zone", mean coloured(200,200,200) AS "Mean"