

Dynamic RSI
January 30, 2019, 12:18 PM
Indicators
13 Comments
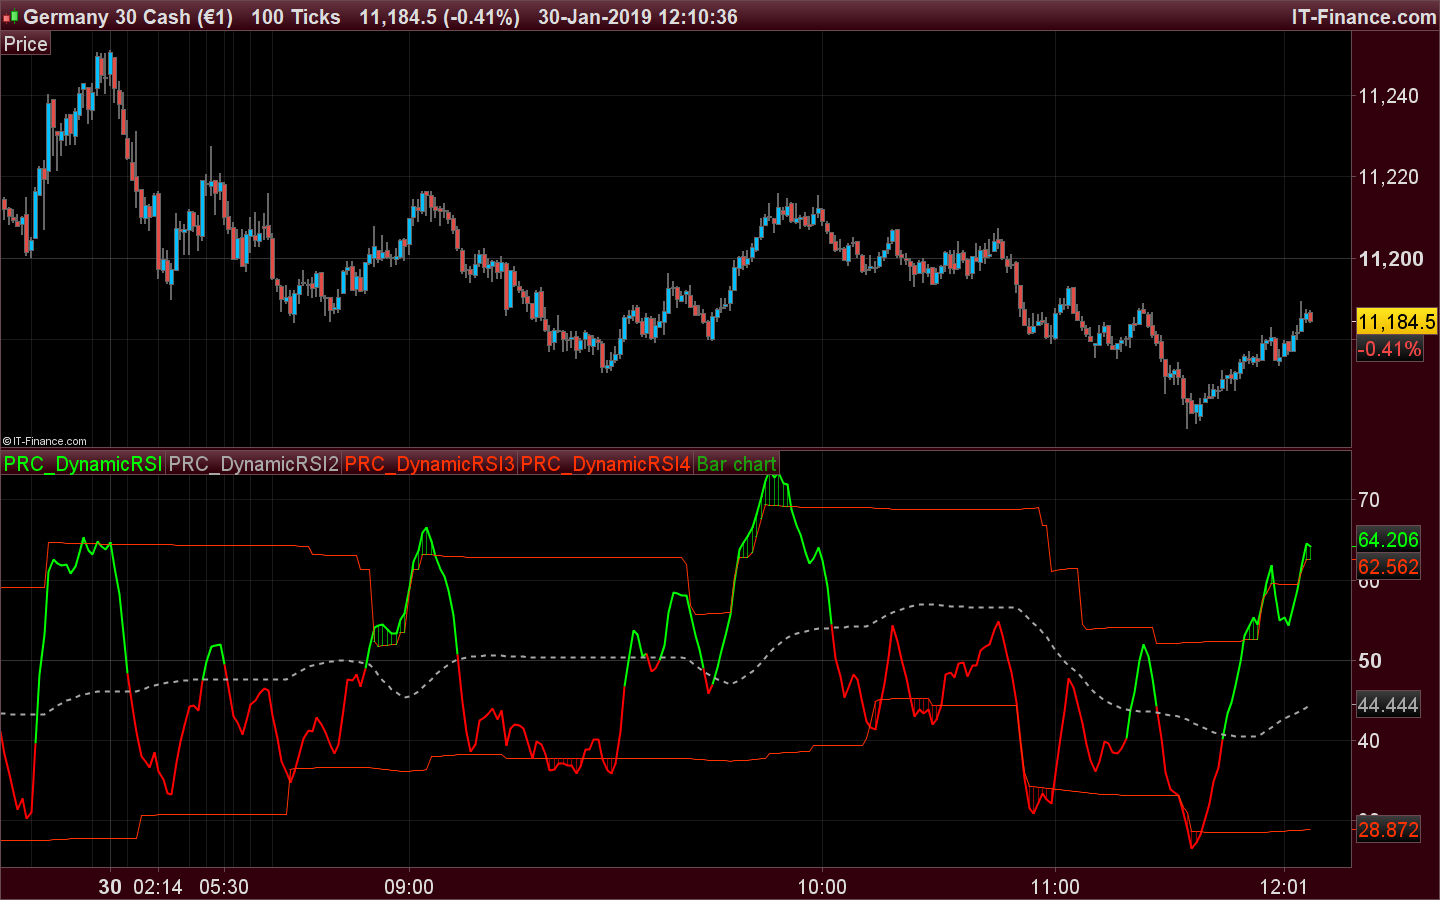
The Dynamic RSI indicator is a kind of exponential RSI. The overbought and oversold levels (respectively HiLine and LoLine) are calculated according to the recent highest and lowest values of the Dynamic RSI line.
The code has been converted from the Amibroker version, as per a request in the English forum section.
//PRC_DynamicRSI | indicator
//30.01.2019
//Nicolas @ www.prorealcode.com
//Sharing ProRealTime knowledge
//converted from Amibroker code

// --- settings
DZbuy = 0.1 //Buy Zone Probability
DZsell = 0.1 //Sell Zone Probability
Period = 14 //RSI Period
Lb = 60 //LookBack Period
// --- end of settings

RSILine = RSI[Period](close)
jh = highest[lb](RSILine)
jl = lowest[lb](RSILine)
jc = (WeightedAverage[period](jh-jl)*0.50)+WeightedAverage[period](jl)
Hiline = jh-jc*DZbuy
Loline = jl+jc*DZsell

R =  ( 4 * RSILine + 3 * RSILine[1] + 2 * RSILine[2] + RSILine[3] ) / 10

if R > jc then
 colr=0
 colg=255
else
 colr=255
 colg=0
endif

if R > hiline then
 drawbarchart(hiline,r,hiline,r) coloured(colr,colg,0,150)
elsif R < loline then
 drawbarchart(loline,r,loline,r) coloured(colr,colg,0,150)
endif

return R coloured(colr,colg,0) style(line,2), jc coloured(168,168,168) style(dottedline,2), hiline coloured(255,50,0),loline coloured(255,50,0)
Download
Filename:
PRC_DynamicRSI.itf
Downloads:
552
Master
I created ProRealCode because I believe in the power of shared knowledge. I spend my time coding new tools and helping members solve complex problems.
If you are stuck on a code or need a fresh perspective on a strategy, I am always willing to help. Welcome to the community!
Author’s Profile
Loading...