

Dynamic Indicator
I present this new “Dynamic Indicator”.
Aesthetics is in the form of a histogram for more simplicity, it is as useful as my last indicator “Volatility and Amplitude“.
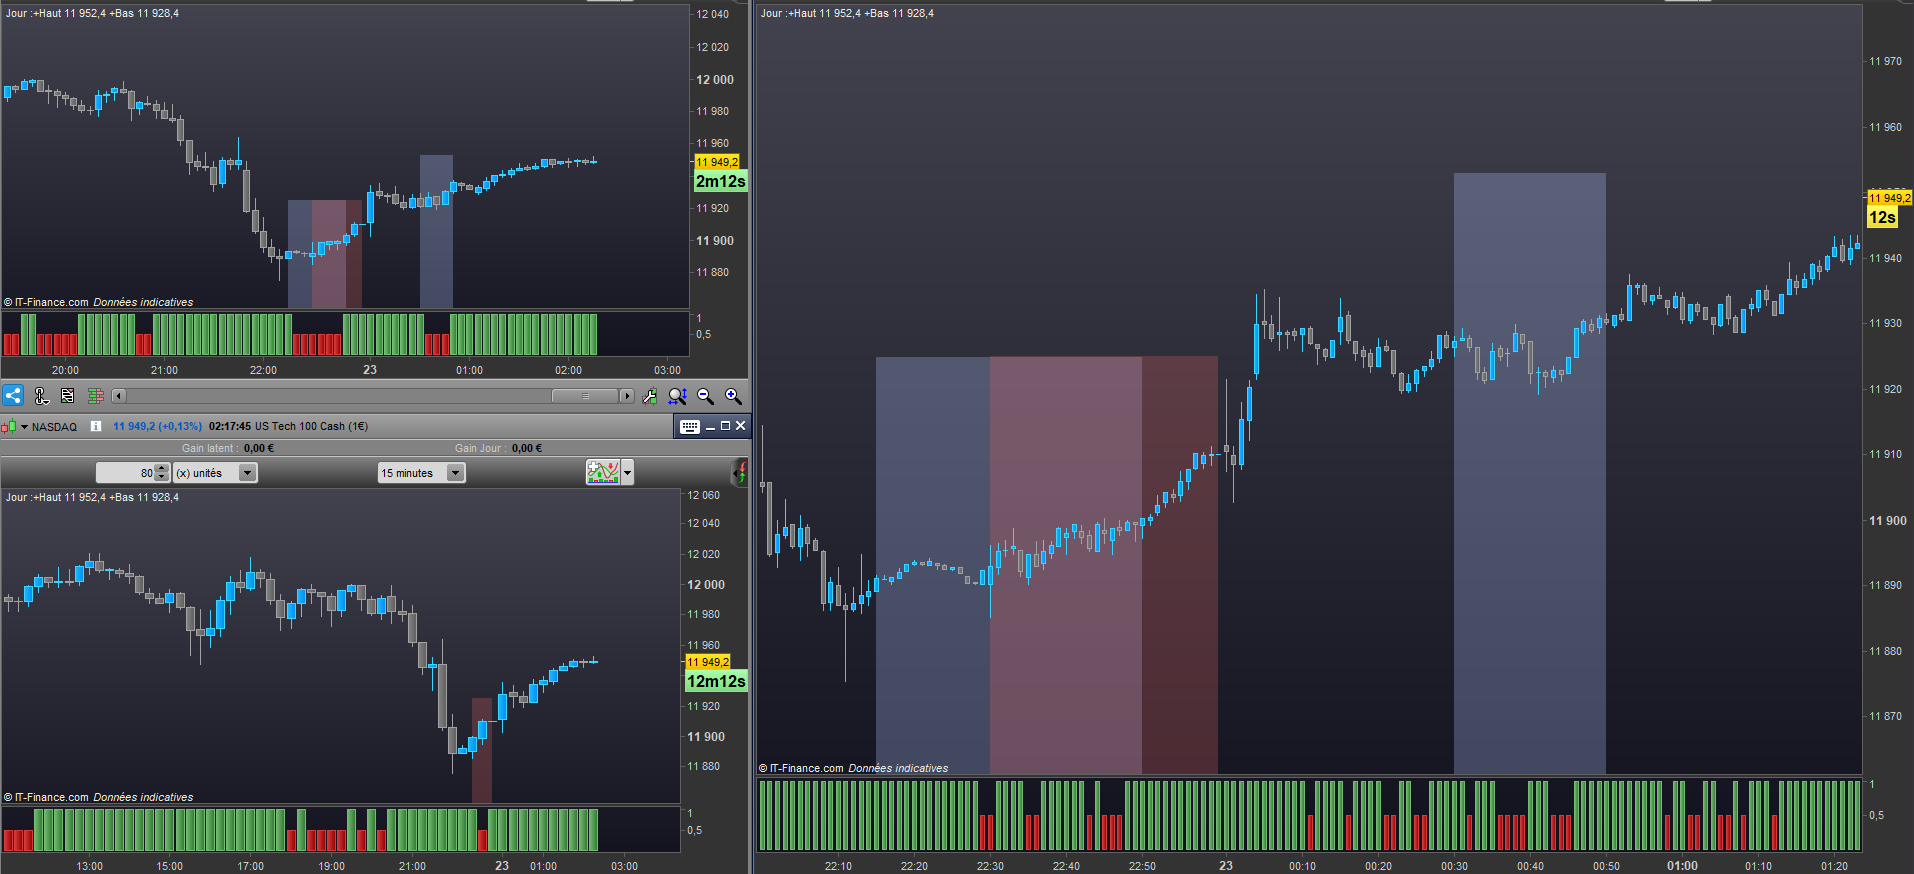
Using a range indicator, Dynamic Indicator is able to calculate price volatility and the amplitude of a movement.If the amplitude is less than the volatility, then the indicator detects a non-dynamic phase, these phases are represented by the red candlesticks.
Conversely, if the amplitude is good, then the indicator returns a green candlestick.
The current setting is fine, I use this indicator on three different timeframes to avoid using too high volatility parameters and miss the start of opportunities.
I find that in this form it gives its full potential.However, as an external variable, you can change the volatility parameters.
The rectangles were drawn manually to image the information of the indicator on the three temporalities.
To sum up, it is not advisable to take opportunities in non-directional phases.
IV
//
//=/===============/=//=/===============/=//=/ Management
//

Value = 0.45

//
//=/===============/=//=/===============/=//=/ Range Fast
//


once FxRRange=close

Fxscale = 2.338*average[14,1](abs(close-close[1]))

FxR = average[27,1](FxScale)
FxHH = close
FxLL = close

if FxHH > FxRRange[1] then
if (FxHH-FxR) < FxRRange[1] then
FxRRange = FxRRange[1]
else
FxRRange = (FxHH-FxR)
endif
elsif (FxLL+FxR) > FxRRange[1] then
FxRRange = FxRRange[1]
else
FxRRange = (FxLL+FxR)
endif

FxTrend = FxRRange
FxURange = FxRRange + FxR
FxDRange = FxRRange - FxR

//
//=/===============/=//=/===============/=//=/ Range Low
//

once LxRRange=close

LxR = 2.338*average[14,1](abs(close-close[1]))
LxHH = high
LxLL = low

if LxHH > LxRRange[1] then
if (LxHH-LxR) < LxRRange[1] then
LxRRange = LxRRange[1]
else
LxRRange = (LxHH-LxR)
endif
elsif (LxLL+LxR) > LxRRange[1] then
LxRRange = LxRRange[1]
else
LxRRange = (LxLL+LxR)
endif

LxTrend = LxRRange
LxURange = LxRRange + LxR
LxDRange = LxRRange - LxR

//
//=/===============/=//=/===============/=//=/ Trend Line
//

//=/ Trend Line
TLr = (FxTrend+LxTrend)/2
AvTrD1 = (TLr+TLr[1])/2
AvTrD2 = (AvTrD1-TLr)/15
TrDL = AvTrD1-AvTrD2

//=/ Up Range
XURange = ((FxURange+LxURange)/2)

//=/ Dw Range
XDRange = ((FxDRange+LxDRange)/2)

//
//=/===============/=//=/===============/=//=/ Volatility & Amplitude Settings
//

//=/ Decompte Haussier
UAmp = 0
if close > TrDL then
UAmp = UAmp[1]+1
endif

//=/ Decompte Baissier
DAmp = 0
if close < TrDL then
DAmp = DAmp[1]+1
endif

//=/ Decompte Global
Amp = UAmp+DAmp
if Amp < Amp[1]-1 then
Amp = Amp[Amp]-Amp
endif

VRange = 0
if TrDL = TrDL[1] then
VRange = VRange[1]+1
endif

//=/ Decompte Amplitude
OAmp = (Amp-VRange)-VRange
if OAmp < 0 then
OAmp = 0
endif

if OAmp < OAmp[1]-1 then
OAmp = OAmp[1]-1
endif

if OAmp > OAmp[1]+1 then
OAmp = OAmp[1]+1
endif

//=/ Decompte final
if VRange > OAmp then
OAmp = VRange
endif

P = round(OAmp)

//=/ Volatility
Volatilite = ((XURange*Value)-(XDRange*Value))

//=/ Amplitude
if close > open then
XLow = open
XHigh = close
elsif close < open then
XLow = close
XHigh = open
endif

if close > TrDL then
Amplitude = close-Lowest[P](Xlow)
elsif close < TrdL then
Amplitude = Highest[P](Xhigh)-close
endif

//
//=/===============/=//=/===============/=//=/ Color
//

if Amplitude > Volatilite then
HXAmp = 1
BXAmp = 0
elsif Amplitude < Volatilite then
BXAmp = 0.5
HXAmp = 0
endif

drawcandle(BXAmp,HXAmp,BXAmp,HXAmp)

return