

Dynamic ATR
Good Day PRT Community
It has been a while since I last shared an indicator to the PRT library so here is something I coded today that might give a more accurate reflection of the Average True Range.
The basic idea was to create an ATR that will adapt to its timeframe by only considering the intraday price movements if a timeframe of smaller than Daily is used or looking only at price data for the week if a Daily timeframe is used. At this stage, Daily is the highest supported timeframe.
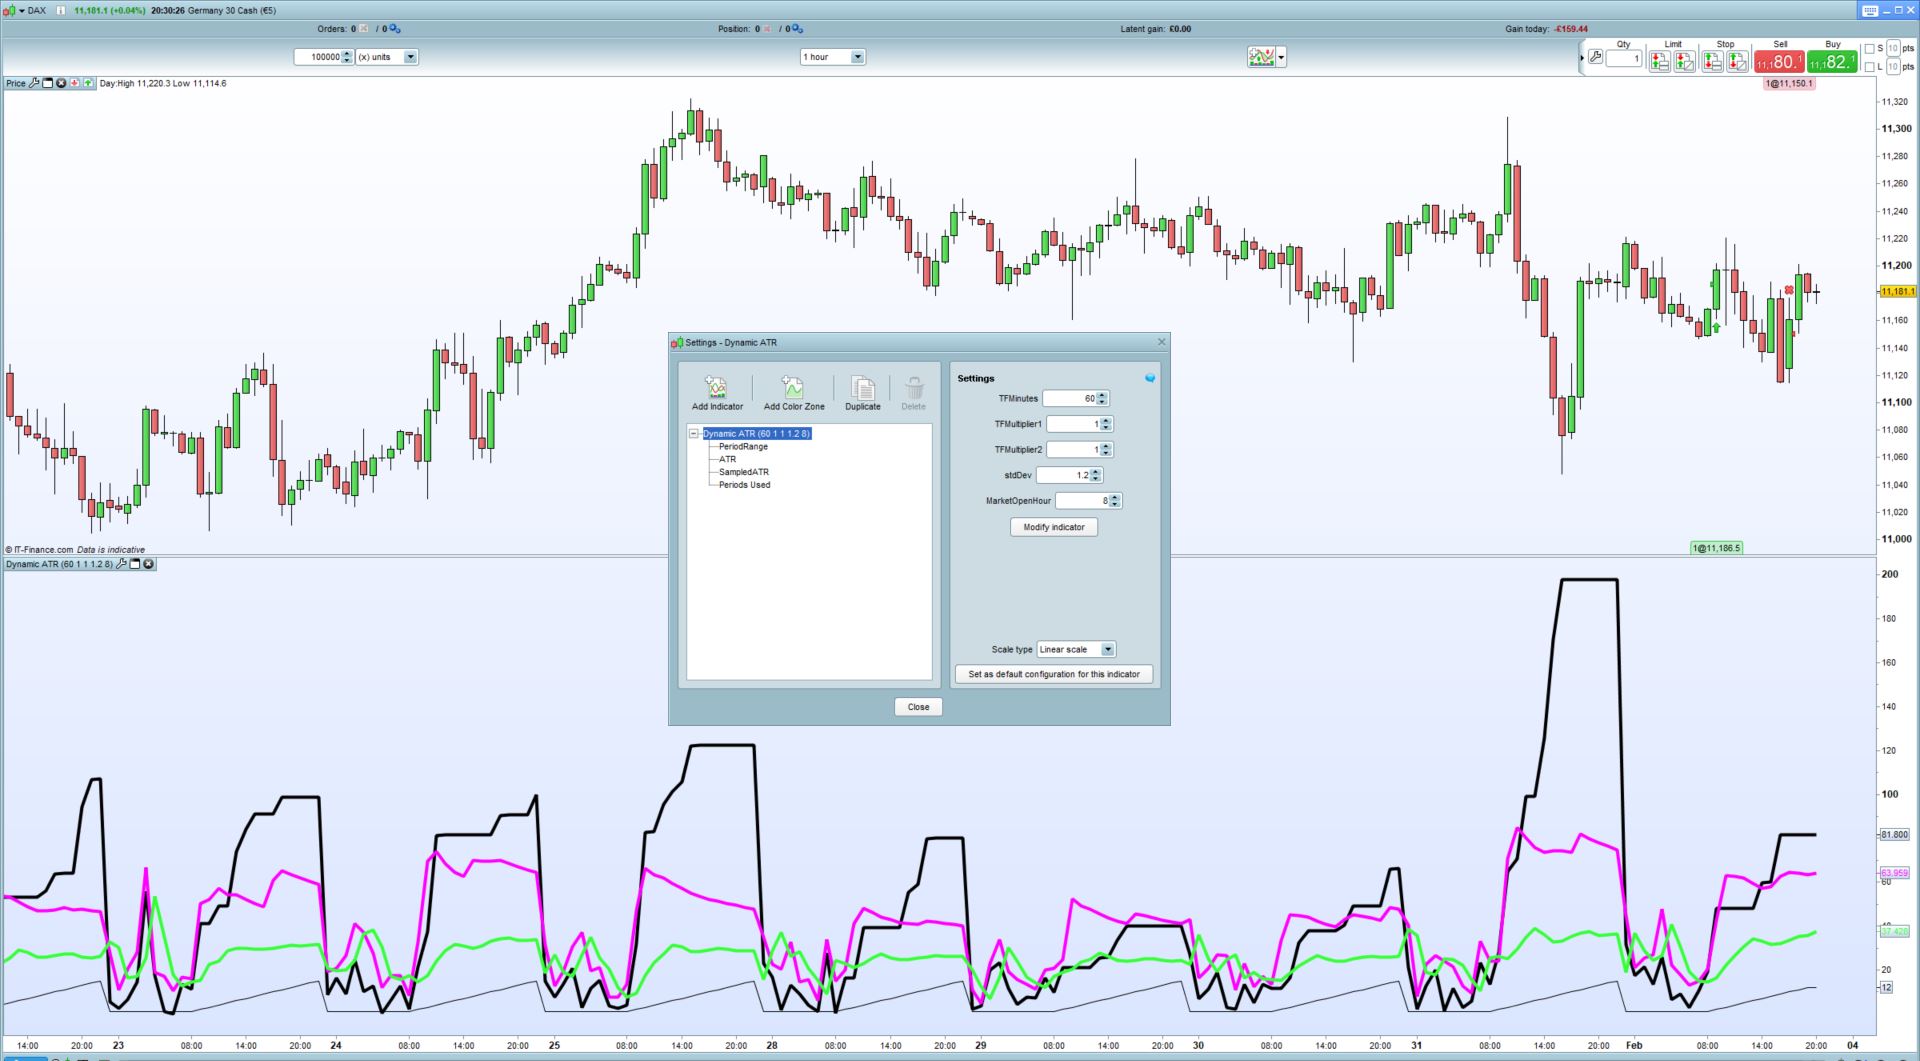
The parameters are as follow:
TFMinutes: Enter your timeframe in minutes. All default timeframes are supported up to Daily (i.e. 5m = 5, 1H = 60, 4H = 240, Daily = 1440, etc.)
TFMultiplier1: For those too lazy to work out higher timeframes you can use the multipliers (i.e. to get to 3H timeframe use 60 as TFMinutes and 3 as TFMultiplier1)
TFMultiplier2: Extention to the above functionality
stdDev: standard deviation used to calculate the Relative ATR line
MarketOpenHour: The opening hour of the market
Three different ATR values are calculated:
- The total price range for the intraday trading session (TF < Daily) or total price range of the weekly trading data (TF = Daily)
- Relative ATR calculated using an average and taking into account standard deviation
- Sampled ATR using price data from three different data sets within the evaluation period
//Dynamic ATR v1.0 (For ProRealTime)
//By Juan Jacobs
//www.FXautomate.com

defparam calculateonlastbars = 1440

//Default Parameters:
//TFMinutes = 60 (Integer)
//TFMultiplier1 = 1 (Integer)
//TFMultiplier2 = 1 (Integer)
//stdDev = 1.2 (Decimal)
//MarketOpenHour = 8 (Integer)

TF = TFMinutes*TFMultiplier1*TFMultiplier2
OpenMin = MarketOpenHour*60

If TF >= 1440 Then
per = ((DayofWeek*TF)-(1440-OpenMin)-((24-Hour)*60))/TF
ElsIf TF >= 60 Then
per = (1440-OpenMin-((24-Hour)*60))/TF
Else
per = (1440-OpenMin-((24-Hour)*60)+minute)/TF
EndIf

If per < 1 Then
per = 1
Else
per = abs(round(per))
EndIf

PeriodHigh = Max(Highest[per](close),Highest[per](open))
PeriodLow = Min(Lowest[per](close),Lowest[per](open))

PeriodRange = PeriodHigh - PeriodLow
RelativeATR = average[per](range)+stdDev*STD[per](range)

If abs(Round(per/5)) < 1 then
Sample1 = 1
Else
Sample1 = abs(Round(per/5)) //Represents first and last 20% of data
EndIf
If abs(Round(per/2.5)) < 1 Then
Sample2 = 1
Else
Sample2 = abs(Round(per/2.5)) //Represents middle 40% of data
EndIf
Sample3 = Sample1 + Sample2
SampledATR = average[per](((AverageTrueRange[Sample1](close)[Sample3])+(AverageTrueRange[Sample2](close)[Sample1])+(AverageTrueRange[Sample1](close)[1]))/3)

Return PeriodRange coloured(0,0,0) style(line,4) as "PeriodRange",RelativeATR coloured(255,0,255) style(line,4) as "ATR", SampledATR coloured(55,255,55) style(line,4) as "SampledATR", per as "Periods Used"