

DSS Bressert Scalper Improved
August 18, 2016, 2:05 PM
Indicators
12 Comments
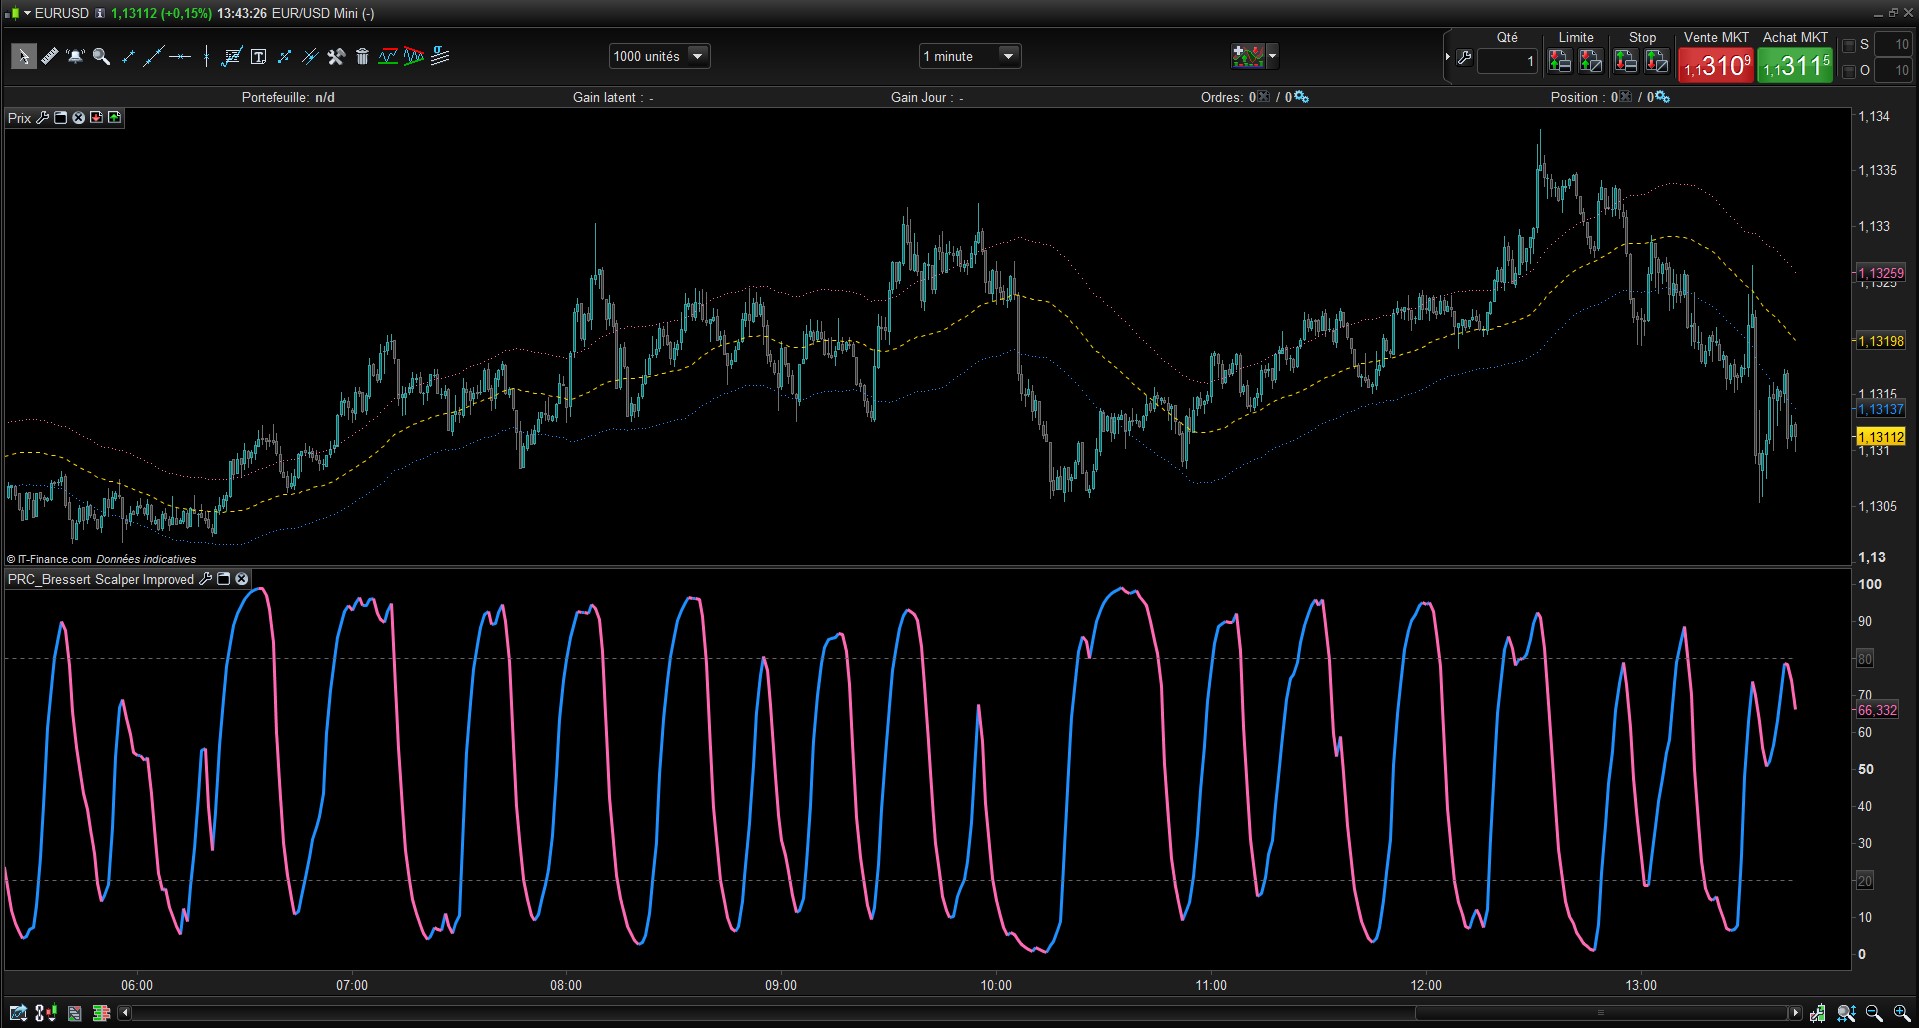
This indicator is derived from Bressert’s works in market cycles (Double Smooth Stochastic). It is converted from MT4 code and it is a part of a complete trading strategy of scalping, I certainly post on forums soon.
The DSS indicator is intended to spot overbought and oversold areas with less false signals than any other stochastic indicator. When the oscillator remains longer into one of the area, it is the beginning of a trend change.
I found it useful to spot price rebound while in a already formed trend. Of course, because stochastic is most used to find price reversal over a calculated price center, this indicator can also be nicely used in ranging markets.
EMAperiod=8
STOperiod=13

once DssBuffer = 50
once MitBuffer = 30
smoothcoefficient = 2.6 / (1 + EMAperiod)

if barindex>STOperiod then
 //price range definitions
 HighRange = Highest[STOperiod](high)
 LowRange = Lowest[STOperiod](low)
 delta = Close - LowRange
 rrange = HighRange-LowRange
 if rrange = 0 then
  rrange = 1*ticksize
 endif
 MIT = delta/rrange*100.0
 MitBuffer = ROUND(smoothcoefficient * (MIT -  MitBuffer[1]) + MitBuffer[1])

 //DSS calculation
 HighRange=0
 LowRange=stoperiod*1000
 for i = 0 to Stoperiod do
  HighRange=Max(MitBuffer[i],HighRange)
  LowRange=Min(MitBuffer[i],LowRange)
 next
 delta = MitBuffer - LowRange
 DSS = delta/(HighRange - LowRange)*100.0
 DssBuffer = smoothcoefficient * (DSS - DssBuffer[1]) + DssBuffer[1]
endif

// 30.144.255 / blue
// 255.105.180 / hot pink

RETURN dssbuffer as "DSS Bressert Scalper", 20 coloured(102,102,102) as "20 level", 80 coloured(102,102,102) as "80 level"
Download
Filename:
PRC_Bressert-Scalper-Improved.itf
Downloads:
518
Master
I created ProRealCode because I believe in the power of shared knowledge. I spend my time coding new tools and helping members solve complex problems.
If you are stuck on a code or need a fresh perspective on a strategy, I am always willing to help. Welcome to the community!
Author’s Profile
Loading...