

DSS Bressert (Double Smoothed Stochastic)
August 1, 2019, 12:55 PM
Indicators
1 Comment
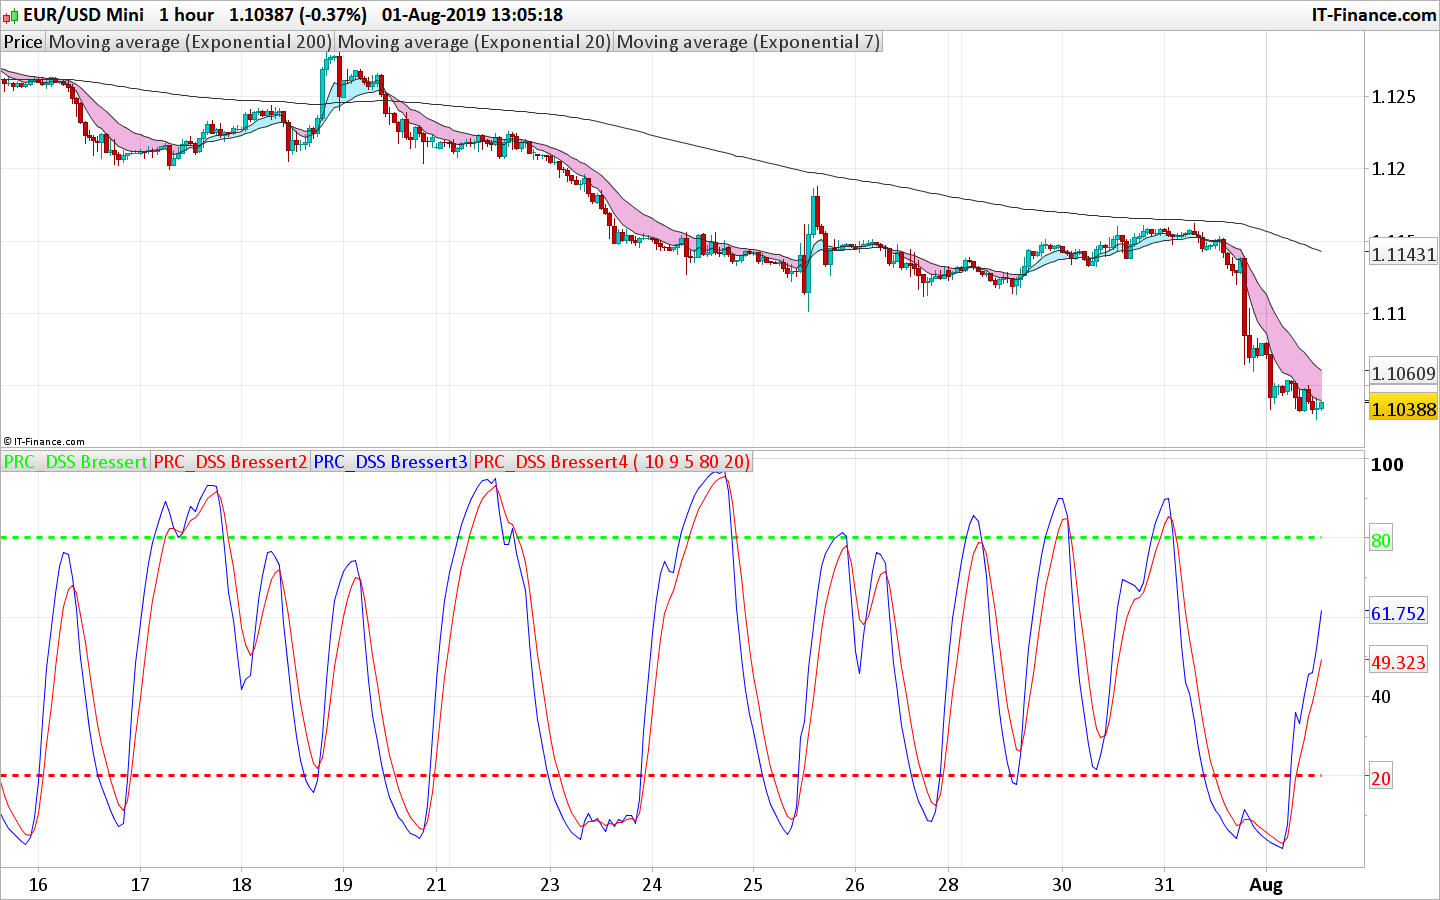
The Double Smoothed Stochastic indicator was proposed by William Blau and Walter Bressert. The calculation of the DSS values is similar to the Stochastic indicator, the difference is the use of the double exponential smoothing.
The interpretation of the DSS values is the same as for Stochastic – the values above 80 indicate the state of overbought market, the values below 20 indicate the state of the oversold market.
//PRC_DSS Bressert | indicator
//01.08.2019
//Nicolas @ www.prorealcode.com
//Sharing ProRealTime knowledge

// --- settings
PDS = 10
EMAlen = 9
TriggerLen = 5
Overbought = 80
Oversold = 20
// --- end of settings

sto1 = stochastic[PDS,1](close)
xPreCalc = average[EMAlen,1](sto1)

storange = highest[PDS](xPreCalc)-lowest[PDS](xPrecalc)
sto2 = (xPrecalc-lowest[PDS](xPrecalc))/storange*100

//sto2 = stochastic[PDS,1](xPreCalc)
xDSS = average[EMAlen,1](sto2)
xTrigger = average[TriggerLen,1](xDSS)

RETURN overbought coloured(0,255,0) style(dottedline,3), oversold coloured(255,0,0) style(dottedline,3),xDSS coloured(0,0,255),xTrigger coloured(255,0,0)
Download
Filename:
PRC_DSS-Bressert.itf
Downloads:
420
Master
I created ProRealCode because I believe in the power of shared knowledge. I spend my time coding new tools and helping members solve complex problems.
If you are stuck on a code or need a fresh perspective on a strategy, I am always willing to help. Welcome to the community!
Author’s Profile
Loading...