

DSL synthetic EMA momentum
October 11, 2018, 10:27 AM
Indicators
2 Comments
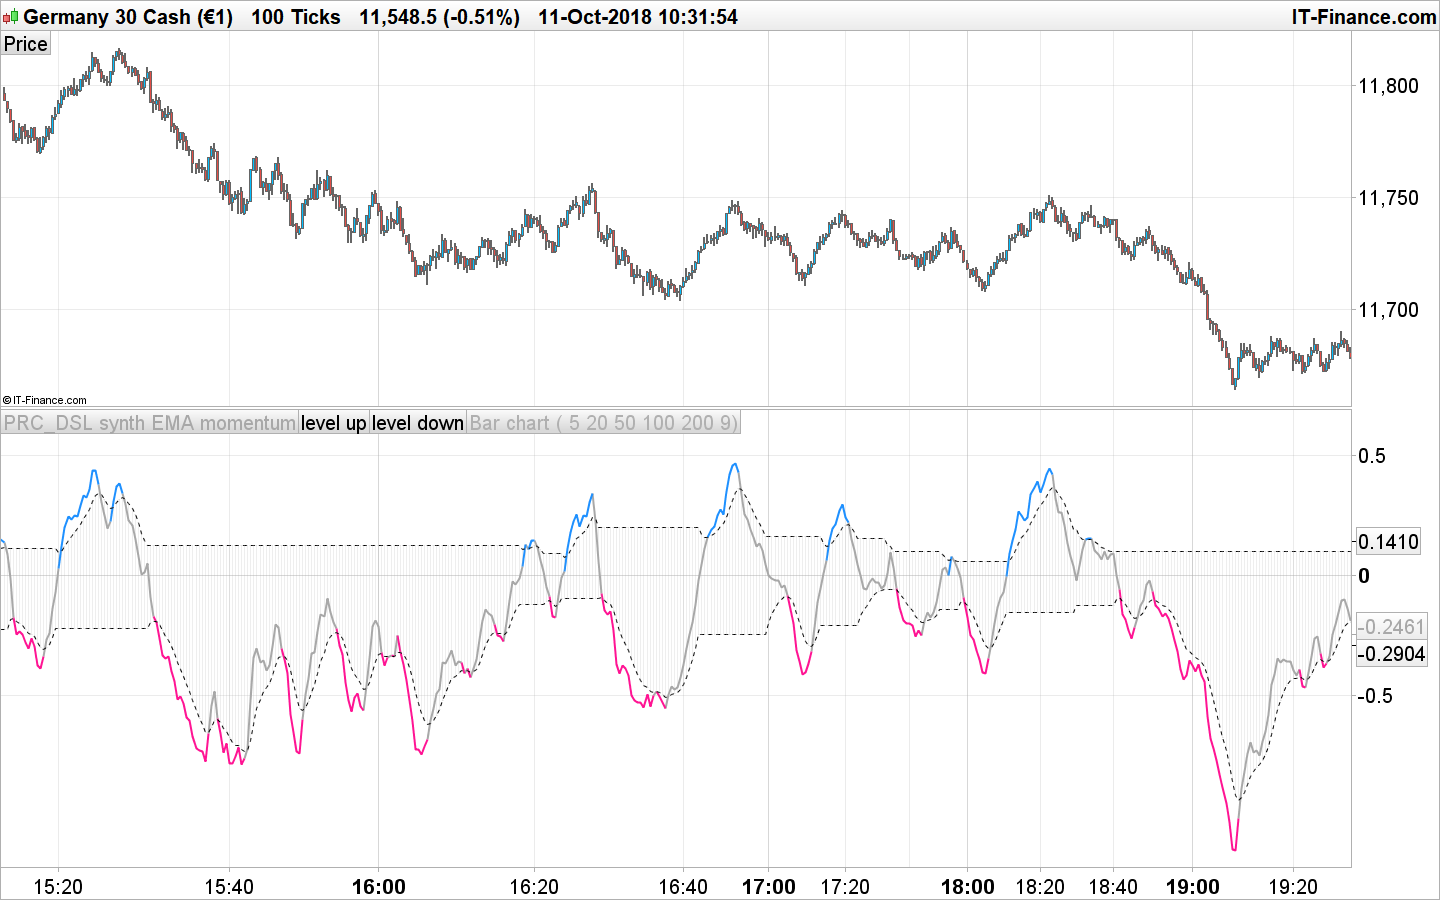
This indicator combines 5 exponential moving average of different periods, calculate their momentum and synthesize the result into 1 single curve.
Dynamic levels made of the discontinued signal lines function are added to create pseudo overbought and oversold levels.
//PRC_DSL synthetic EMA momentum | indicator
//11.10.2018
//Nicolas @ www.prorealcode.com
//Sharing ProRealTime knowledge
//converted from MT5 version

// --- settings
inpPeriod1  = 5           // Period 1
inpPeriod2  = 20          // Period 2
inpPeriod3  = 50          // Period 3
inpPeriod4  = 100         // Period 4
inpPeriod5  = 200         // Period 5
inpSignal   = 9           // Signal period
// --- end of settings

Price = customclose

avg = average[inpPeriod1,1](price)
avg1 = average[inpPeriod2,1](price)[1]
mom1 = 100*(avg-avg1)/avg1
avg2 = average[inpPeriod3,1](price)[2]
mom2 = 100*(avg-avg2)/avg2
avg3  = average[inpPeriod4,1](price)[3]
mom3 = 100*(avg-avg3)/avg3
avg4  = average[inpPeriod5,1](price)[4]
mom4 = 100*(avg-avg4)/avg4

val = (mom4 +mom3*inpPeriod5/inpPeriod4+mom2*inpPeriod5/inpPeriod3+mom1*inpPeriod5/inpPeriod2)/4.0

alpha = 2.0/(1.0+inpSignal)

if val>0 then
 levelu = levelu[1]+alpha*(val-levelu[1])
endif
if val<0 then
 leveld = leveld[1]+alpha*(val-leveld[1])
endif

//OB and OS colors
r=168
g=168
b=168
if val>levelu then
 r=30
 g=144
 b=255
elsif val<leveld then
 r=255
 g=20
 b=147
endif

drawbarchart(levelu,leveld,levelu,leveld) coloured(168,168,168,50)

return val coloured(r,g,b) style(line,2), levelu style(dottedline) as "level up", leveld style(dottedline) as "level down"
Download
Filename:
PRC_DSL-synth-EMA-momentum.itf
Downloads:
354
Master
I created ProRealCode because I believe in the power of shared knowledge. I spend my time coding new tools and helping members solve complex problems.
If you are stuck on a code or need a fresh perspective on a strategy, I am always willing to help. Welcome to the community!
Author’s Profile
Loading...