

DOWAR(OAC) - Day Of Week Average Range (On Any Chart)
This indicator is a further adaptation of the DOWAR – Day Of Week Average Range indicator that can be found here:
https://www.prorealcode.com/prorealtime-indicators/dowar-day-of-week-average-range-bands/
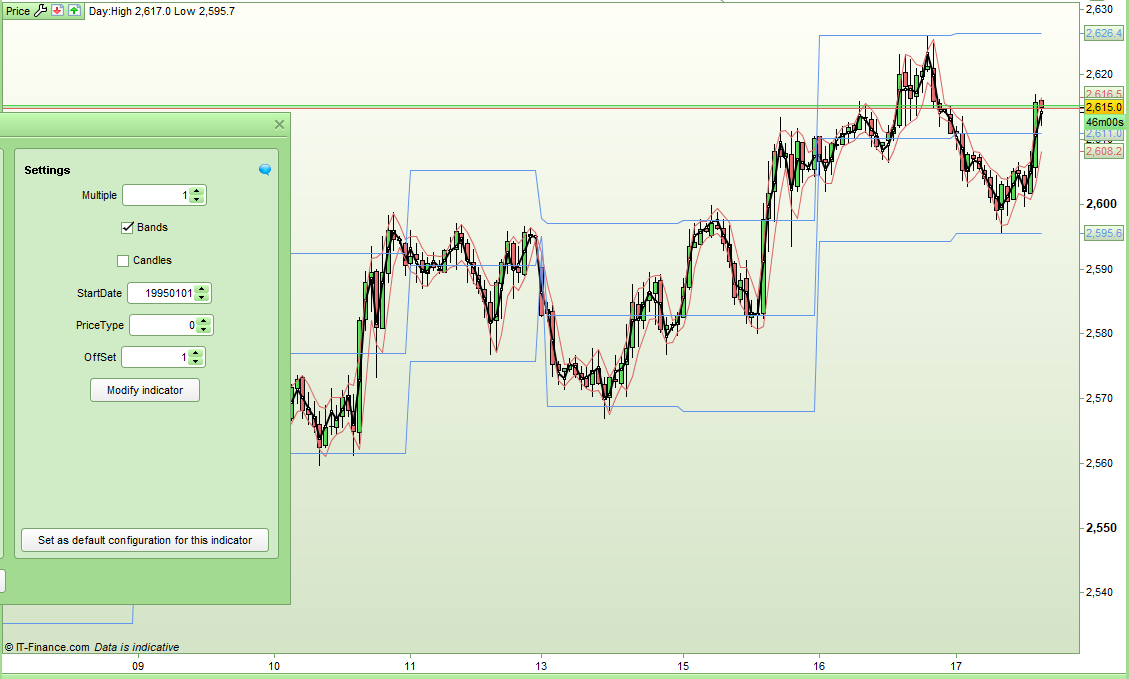
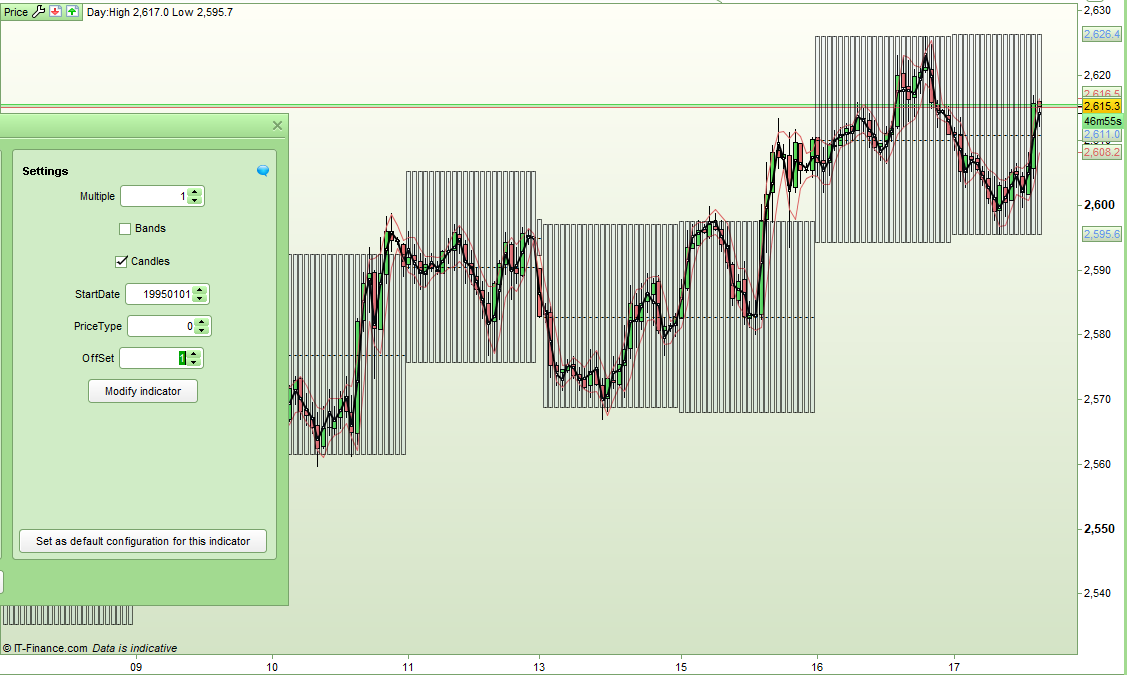
This new version is not just limited to use on the daily chart but can be used on any chart time frame – daily or faster – so now it is possible to see day of week average range bands on a 5 minute chart for example. This new version also has a mid line in addition to the upper and lower levels.
The indicator calculates an all time average range for each day of the week and then applies it to the chart as bands or a background candle or both. So for example on Monday candles the bands (or background candle) will represent the all time average range for all recorded Mondays in history up to that date.
The bands/candles can be made wider or narrower by adjusting the ‘Multiple’ setting.
The centre of the bands can be based on any custom close such as median price, close, typical price, total price etc. Choose your price type by changing the PriceType setting:
0 = close
1 = median price
2 = total price
3 = typical price
4 = weighted close
By adjusting the offset you can decide which day the bands/candles will be centred on. 0 = todays, 1 = yesterdays.
You can set the start date from when the indicator should start calculating the daily averages. Set StartDate to zero if you want to use all available history.
I recommend that you download the itf file and import it to get full functionality rather than cut and pasting the code.
//DOWAROAC Bands - Day Of Week Average Range (On Any Chart) Bands
//By Vonasi
//20190117

//Multiple = 1
//Offset = 1
//Bands = 0
//Candles = 1
//StartDate = 0

if opendate >= StartDate or startdate = 0 then
if opendayofweek[0] <> opendayofweek[1] then
rnge = (dHigh(1) - dLow(1))

//close
if offset = 1 then
if pricetype < 1 or pricetype > 4 then
start = close[1]
endif
//medianprice
if pricetype = 1 then
start = ((rnge)/2) + dlow(1)
endif
//totalprice
if pricetype = 2 then
start = (dopen(1) + close[1] + dHigh(1) + dLow(1))/4
endif
//typicalprice
if pricetype = 3 then
start = (close[1] + dHigh(1) + dLow(1))/3
endif
//weightedprice
if pricetype = 4 then
start = ((2*close[1]) + dHigh(1) + dLow(1))/4
endif
endif

if opendayofweek[1] = 0 THEN
W0 = (W0 + (rnge))
W0Count = (W0Count + 1)
endif

IF opendayofweek[1] = 1 THEN
W1 = (W1 + (rnge))
W1Count = (W1Count + 1)
endif

IF opendayofweek[1] = 2 THEN
W2 = (W2 + (rnge))
W2Count = (W2Count + 1)
endif

IF opendayofweek[1] = 3 THEN
W3 = (W3 + (rnge))
W3Count = (W3Count + 1)
endif

IF opendayofweek[1] = 4 THEN
W4 = (W4 + (rnge))
W4Count = (W4Count + 1)
endif

IF opendayofweek[1] = 5 THEN
W5 = (W5 + (rnge))
W5Count = (W5Count + 1)
endif

if opendayofweek = 0 then
ThisDay = (W0 / W0Count)
endif

if opendayofweek = 1 then
ThisDay = (W1 / W1Count)
endif

if opendayofweek = 2 then
ThisDay = (W2 / W2Count)
endif

if opendayofweek = 3 then
ThisDay = (W3 / W3Count)
endif

if opendayofweek = 4 then
ThisDay = (W4 / W4Count)
endif

if opendayofweek = 5 then
ThisDay = (W5 / W5Count)
endif
endif

if offset <> 1 then
if pricetype < 1 or pricetype > 4 then
start = close[1]
endif
//medianprice
if pricetype = 1 then
start = ((dhigh(0) - dlow(0))/2) + dlow(0)
endif
//totalprice
if pricetype = 2 then
start = (dopen(0) + close[0] + dHigh(0) + dLow(0))/4
endif
//typicalprice
if pricetype = 3 then
start = (close[0] + dHigh(0) + dLow(0))/3
endif
//weightedprice
if pricetype = 4 then
start = ((2*close[0]) + dHigh(0) + dLow(0))/4
endif
endif

upper = start + ((ThisDay * multiple)/2)
lower = start - ((ThisDay * multiple)/2)
middle = ((upper -lower)/2) + lower

if candles then
drawcandle(lower,upper,lower,upper) COLOURED(100,149,237,20) BORDERCOLOR(0,0,0,150)
drawtext("-",barindex,middle) COLOURED(0,0,0)
endif

c = 0
if bands then
c = 255
endif
else
upper = close
lower = close
middle = close
c = 0
endif

RETURN upper coloured (100,149,237,c) style(line, 1) as "Upper Band", lower coloured (100,149,237,c) style(line, 1) as "Lower Band", middle coloured (100,149,237,c) style(line, 1) as "Middle Band"