

double top and double bottom detector - M&W patterns
October 25, 2017, 5:13 PM
Indicators
34 Comments
Hi all,
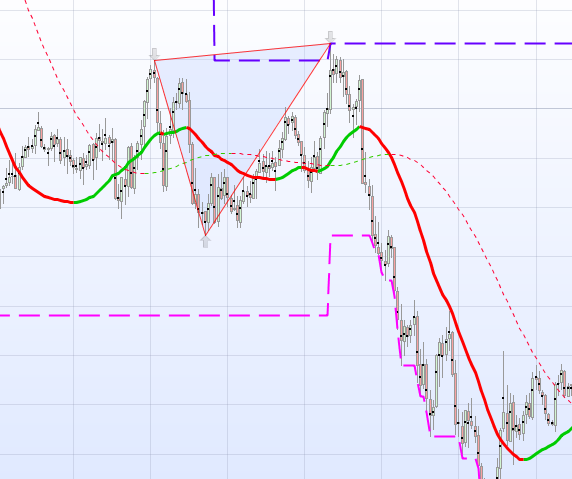
I create an algorithm that detects local minimums and local maximums in the proximity were two crossing moving average are located.
Base on this information, then simple mathematics is use for detect and draw a triangle where a double top is located.
Please check it, improve the algorithm and share your luck!
//LOCALS MINIMUMS AND MAXIMUMS USING LEO MOVING AVERAGE
//Autor: LEO

//VARIABLES TO BE OPTIMIZED

//PERIOD=20    //Period for analysis
//Kdouble=0.2 //Factor for defining what is double top or bottom

//-----------

//Leo Moving Average, formula: LMA= WMA+(WMA-SMA)
LMA=2*weightedaverage[period](close)-average[period](close)

//Smoothed curve of Leo Moving Average
IF BARINDEX > period THEN
 smoothLMA=weightedaverage[period](LMA)
ELSE
 smoothLMA=undefined
ENDIF

// << Storage of minimums and maximums >>
once mintemp=low
once posmintemp=1
once maxtemp=high
once posmaxtemp=1

IF BARINDEX>2 THEN
 // the value 0.75 is to ensure that the donchian channel is faster than the curves analysis (this value to be checked)
 IF low < lowest[round(0.75*period)](low[1]) THEN
  mintemp=low //minimum temporal
  posmintemp=BARINDEX //postition of minimum temporal
 ENDIF
 IF high > highest[round(0.75*period)](high[1]) then
  maxtemp=high //maximum temporal
  posmaxtemp=BARINDEX //position maximum temporal
 ENDIF
ENDIF

//  << Detecting and locating a local minimums >>
//  Where the LMA is crossing the smoothed LMA, there is a maximum or minimum nearby
//  If there is a new local min/max, the preivus one is stored in de varible B... (before)
once LEVMIN=low
once POSLEVMIN=1
once LEVMAX=high
once POSLEVMAX=1
once bullcross=0
once bearcross=0

IF BARINDEX > PERIOD THEN //For avoid computer errors
 bullcross=LMA crosses over smoothLMA
 bearcross=LMA crosses under smoothLMA
ENDIF


IF bullcross THEN
 BLEVMIN=LEVMIN        //previus local minimum is saved
 BPOSLEVMIN=POSLEVMIN
 LEVMIN=mintemp
 POSLEVMIN=posmintemp
 support=LEVMIN
 DRAWARROWUP(POSLEVMIN,LEVMIN) coloured(0,0,0,30)
ENDIF

// --> Detecting and locating a local maximum
IF bearcross THEN
 BLEVMAX=LEVMAX       //previus local maximum is saved
 BPOSLEVMAX=POSLEVMAX
 LEVMAX=maxtemp
 POSLEVMAX=posmaxtemp
 resistance=LEVMAX
 DRAWARROWDOWN(POSLEVMAX,LEVMAX) coloured(0,0,0,30)
ENDIF

support=min(low,support)
resistance=max(high,resistance)


// << DETECTING DOUBLE TOP OR BOTTOMS  >>

once WidthDoubleTop = high-low
once WidthDoubleBottom = high-low

//--> Double bottoms

//looking for the top between two local minimums
IF bullcross THEN
 doublebottomtop=high[BARINDEX-POSLEVMIN+1] // we start looking for the top in between two local minimums
 POSdoublebottomtop=BARINDEX-POSLEVMIN+1
 FOR i = (BARINDEX-POSLEVMIN+1) to (BARINDEX-BPOSLEVMIN-1) DO
  IF high[i] > doublebottomtop THEN
   doublebottomtop=high[i]
   POSdoublebottomtop=BARINDEX-i
  ENDIF
 NEXT
 WidthDoubleBottom = doublebottomtop-(BLEVMIN+LEVMIN)/2 // (top betwen local minimums) - (average of the las two local minimums)
 IF abs(BLEVMIN-LEVMIN) < Kdouble*WidthDoubleBottom THEN
 //       <<<<<<<  HERE WE HAVE A DOUBLE BOTTOM FOR TRADING  >>>>>
  DRAWTRIANGLE(POSLEVMIN,LEVMIN,POSdoublebottomtop,doublebottomtop,BPOSLEVMIN,BLEVMIN) COLOURED(0,255,0,200)
 ENDIF
ENDIF

//--> Double tops

//looking for the bottom between two local maximums
IF bearcross THEN
 doubletopbottom=low[BARINDEX-POSLEVMAX+1]
 POSdoubletopbottom=BARINDEX-POSLEVMAX+1
 FOR i = (BARINDEX-POSLEVMAX+1) to (BARINDEX-BPOSLEVMAX-1) DO
  IF low[i] < doubletopbottom THEN
   doubletopbottom=low[i]
   POSdoubletopbottom=BARINDEX-i
  ENDIF
 NEXT
 WidthDoubleTop=(BLEVMAX+LEVMAX)/2 -doubletopbottom
 IF abs(BLEVMAX-LEVMAX) < Kdouble*WidthDoubleTop THEN
 //       <<<<<<<  HERE WE HAVE A DOUBLE TOP FOR TRADING  >>>>>
 DRAWTRIANGLE(POSdoubletopbottom,doubletopbottom,POSLEVMAX,LEVMAX,BPOSLEVMAX,BLEVMAX) COLOURED(255,0,0,200)
 ENDIF
ENDIF

RETURN LMA AS "Leo Moving Average", support as "support", resistance as "resistance", smoothLMA as "smooth LMA" //, lowest[round(0.75*period)](low[1]), highest[round(0.75*period)](high[1])
Download
Filename:
doubletop-doublebottom-detect.itf
Downloads:
1342
Veteran
" IF YOU HAVE WEALTH , IT'S A DUTY TO HELP THOSE WHO DON'T " Manoj Bhargava
Author’s Profile
Loading...