

DMI Stochastic Oscillator
February 12, 2019, 6:01 PM
Indicators
8 Comments
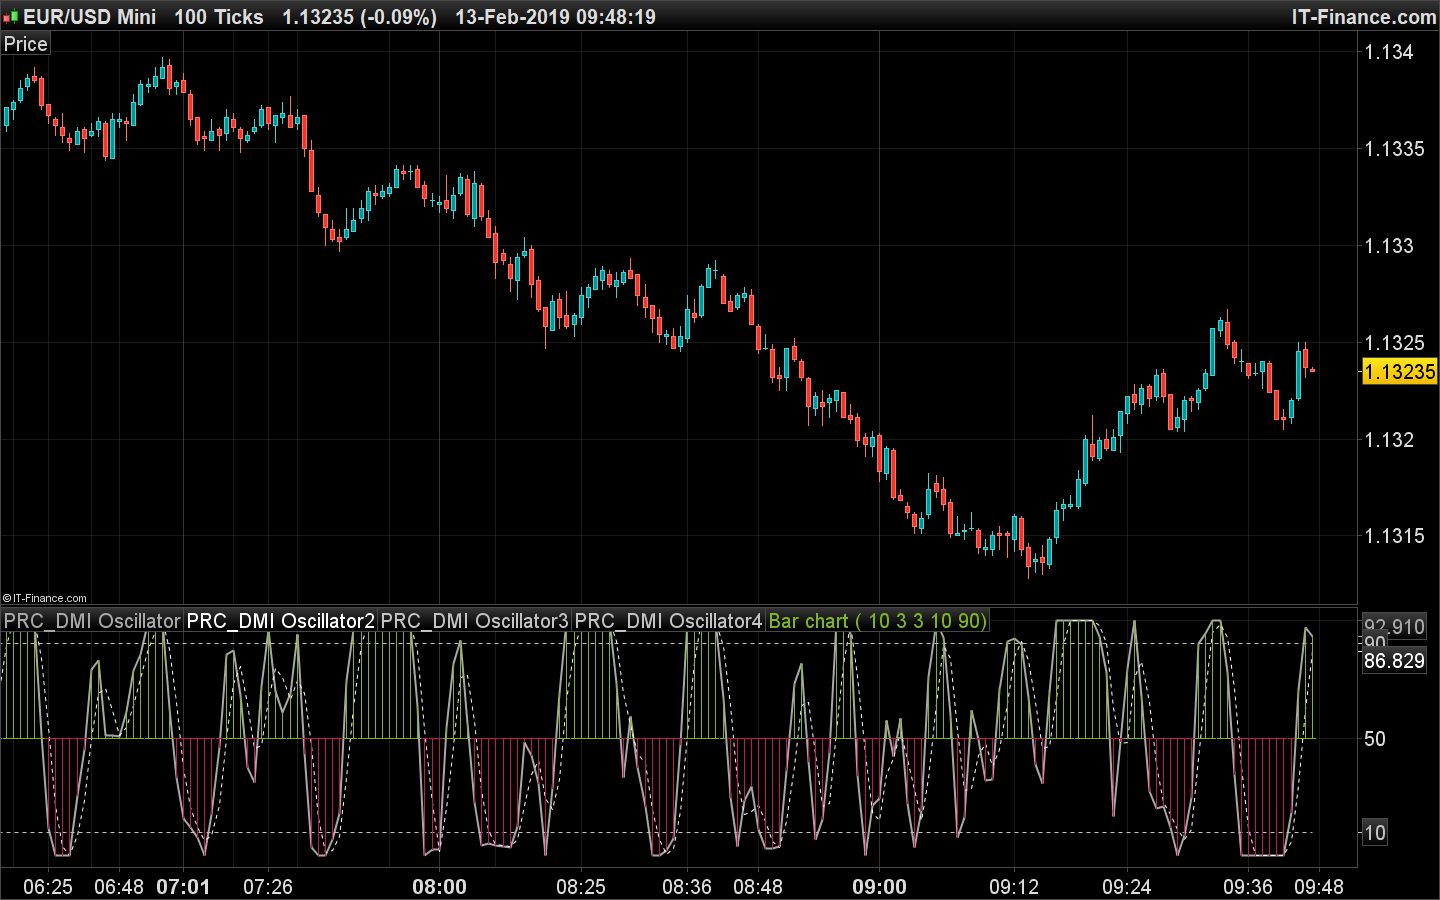
“The DMI stochastic uses the basic formulation for a 10, 3, 3 stochastic oscillator found in most charting packages but replaces the closing price of the price bar with the value of the 10-period DMI oscillator. The overbought and oversold levels are different also. They occur at the 10 and 90 levels instead of the more usual 20 and 80 levels. The DMI stochastic is much faster and less smooth than a stochastic based on price. However, it reaches extremes quickly, which allows for timely entries and exits.”
Barbara Star
//PRC_DMI Oscillator | indicator
//12.02.2019
//Nicolas @ www.prorealcode.com
//Sharing ProRealTime knowledge

// --- settings
DMIlength = 10 //DMI Length
Stolength = 3 //DMI Stochastic Length
Signallength = 3 //Stochastic signal line length
os = 10 //Oversold
ob = 90 //Overbought
// --- end of settings

if barindex>DMIlength then
 // DMI Osc Calc
 hiDiff = high - high[1]
 loDiff = low[1] - low

 if hiDiff>loDiff and hiDiff>0 then
  plusDM=hiDiff
 else
  plusDM=0
 endif
 if loDiff>hiDiff and loDiff>0 then
  minusDM=loDiff
 else
  minusDM=0
 endif

 wwma = ((wwma[1]) * (DMIlength - 1) + AverageTrueRange[1](close)) / DMIlength
 ATR = wwma

 wwmaPlus = ((wwmaPlus[1]) * (DMIlength - 1) + plusDM) / DMIlength
 wwmaMinus = ((wwmaMinus[1]) * (DMIlength - 1) + minusDM) / DMIlength

 PlusDI = 100 * wwmaPlus / ATR
 MinusDI = 100 * wwmaMinus / ATR

 osc = PlusDI - MinusDI

 // DMI Stochastic Calc
 hi = highest[Stolength](osc)
 lo = lowest[Stolength](osc)

 Stoch = summation[Stolength](osc-lo) / summation[Stolength](hi-lo) *100

  if Stoch>50 then
   r=128
   g=181
   b=33
   drawbarchart(50,Stoch,50,50) coloured(r,g,b)
  else
   r=194
   g=25
   b=89
  drawbarchart(50,50,Stoch,50) coloured(r,g,b)
 endif

 signal = average[Signallength](stoch)
endif

return Stoch coloured(168,168,168) style(line,2),signal style(dottedline,1), ob coloured(195,195,195) style(dottedline,1) ,os coloured(195,195,195) style(dottedline,1)
Download
Filename:
PRC_DMI-Oscillator-1.itf
Downloads:
344
Master
I created ProRealCode because I believe in the power of shared knowledge. I spend my time coding new tools and helping members solve complex problems.
If you are stuck on a code or need a fresh perspective on a strategy, I am always willing to help. Welcome to the community!
Author’s Profile
Loading...