

Disparity index with dynamic overbought and oversold areas
July 11, 2017, 5:08 PM
Indicators
0 Comments
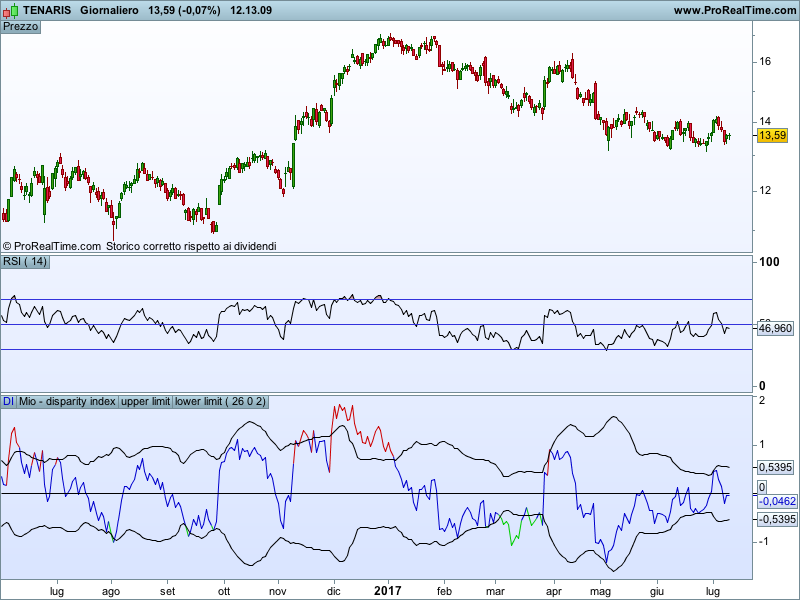
The Disparity Index is a well known indicator used to assess overbought and oversold areas. In this code I added some bands to represent the overbought/oversold areas.
Since the Disparity Index is closely related to RSI by using a EMA130 you would have, on a daily timeframe, also a quite accurate weekly RSI at hand.
Blue skies
//variables
//periodo=130
//tipo=1
//corr=2

//formulas
a=average[periodo,tipo](close)
dispidx=close-a
b=std[periodo](dispidx)
band=corr*b

//colours setup
if dispidx>band then
 r=205
 g=0
 b=0
else
 r=0
 g=0
 b=205
endif
if dispidx<-band then
 r=0
 g=205
 b=0
endif

return dispidx coloured (r,g,b) as "DI",0,band as "upper limit",-band as "lower limit"
Download
Filename:
disparity-index-2.itf
Downloads:
181
Master
As an architect of digital worlds, my own description remains a mystery. Think of me as an undeclared variable, existing somewhere in the code.
Author’s Profile
Loading...