

Discontinued signal line - MACD
A lot of indicators are using signal lines in order to determine the trend (or some desired state of the indicator) easier. The idea of the signal line is easy : comparing the value to it’s smoothed (slightly lagging) state, the idea of current momentum/state is made
Discontinued signal line is inheriting that simple simple idea and it is extending it : instead of having one signal line, more lines depending on the current value of the indicator. “Signal” line is calculated the following way :
- When some level is crossed in the desired direction, ema of that value is calculated for the desired signal line
- When that levels is crossed in the opposite direction, previous “signal” line value is simple “inherited” and it becomes a kind of a level
This way it becomes a combination of signal lines and levels trying to combine the good from both methods
(description from its original author: mladen).
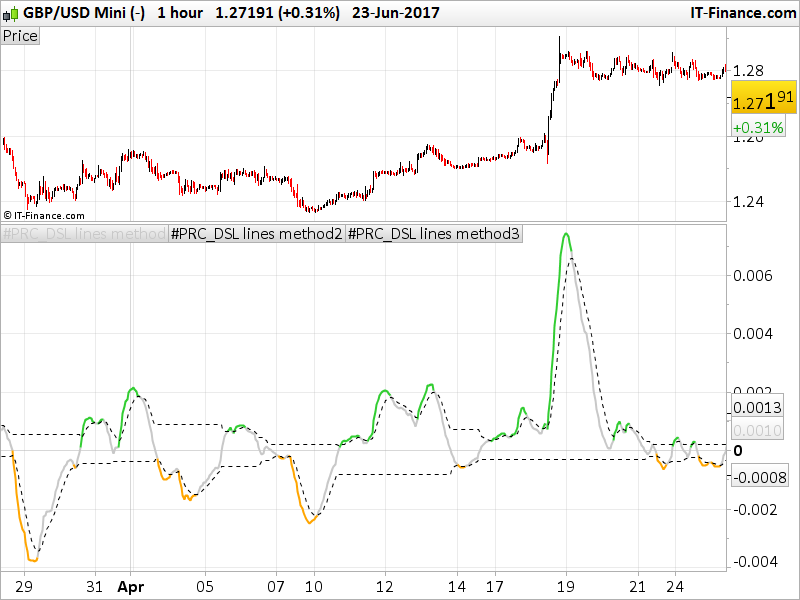
This is the original MACD (difference from 2 exponential moving average) with the “dsl” (discontinued signal line) acting as the signal line to trigger buy/sell orders.
When the oscillator is above the upper signal line, the line is coloured in green (bullish signal), and when it is below the lower signal line, it is coloured in orange (bearish signal).
Code translated from MT4 version.
//PRC_RevertSignal Three Line Break | indicator
//25.06.2017
//Nicolas @ www.prorealcode.com
//Sharing ProRealTime knowledge
//translated from MT4 code

//---settings
//FastEma      = 12       // Fast ema period
//SlowEma      = 26       // Slow ema period
//SignalPeriod = 9        // Signal period
//---end of settings

price = customclose

alpha = 2.0/(1.0+SignalPeriod)

val = average[FastEma,1](price)-average[SlowEma,1](price)

if val>0 then
 levelu = levelu[1]+alpha*(val-levelu[1])
endif
if val<0 then
 leveld = leveld[1]+alpha*(val-leveld[1])
endif

//OB and OS colors
 r=200
 g=200
 b=200
if val>levelu then
 r=50
 g=205
 b=50
elsif val<leveld then
 r=255
 g=165
 b=0
endif

return val coloured(r,g,b) style(line,2), levelu style(dottedline), leveld style(dottedline)