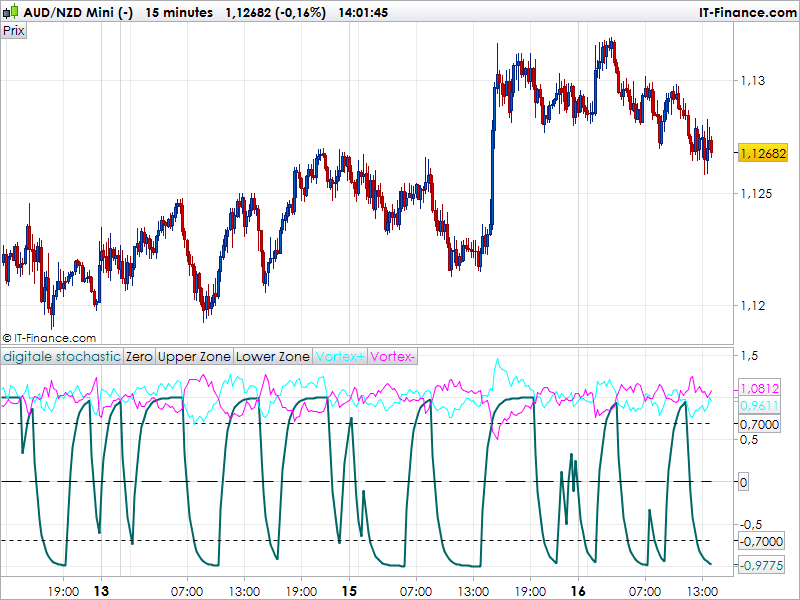
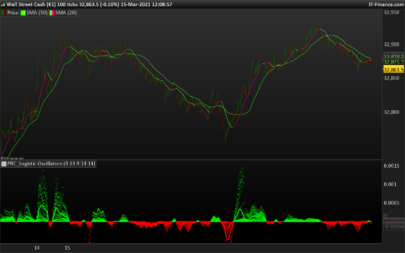
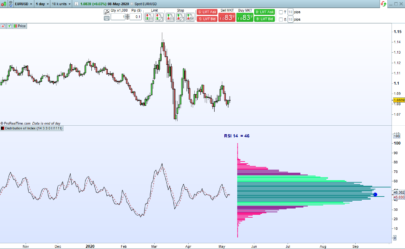
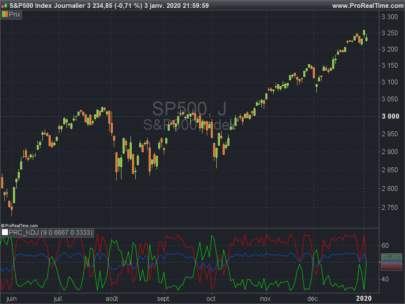
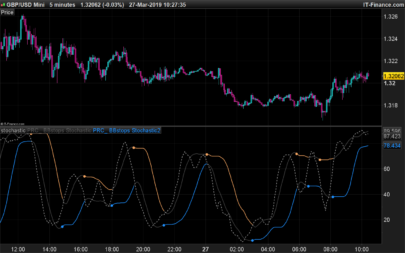
Found this indicator in the Kevin archive. Interesting combination of 2 indicators : a digital stochastic and a “vortex” indicator which is quite similar to a Wilder’s DMI which tell you the current price direction and where it is expected to continue. As for the digital stochastic, it is likely to show where the price is too far from its mean and would return to the opposite side.
So if the “vortex +” is above the “vortex -“, the digital stochastic should give a long trade signal if it crosses the -0.7 “oversold” level. And the opposite conditions for a short trade signal.
|
1 2 3 4 5 6 7 8 9 10 11 12 13 14 15 16 17 18 19 20 21 22 23 24 25 26 27 28 29 30 31 32 33 34 35 36 37 38 39 40 41 42 43 44 45 46 47 |
///////////////digital stochastic c1 = highest[14](high) c2 = lowest[14](low) fastk = ((close - c2) / (c1 - c2) ) * 100 slowk = average[3](fastk) if (22* slowk + 8* fastk) / 30 > 50 THEN sum = 1 else sum= -1 endif d1 = exponentialaverage[5](sum) if d1 > d1[1] then e=d1 f=1 endif if d1<d1[1]then e=d1 f=-1 endif /////////VORTEX MM type //////////////////////////////////////// //variable p=péride --par défaut 14 //variable t = MMtype --par défaut simple (Original) p = 14 t=1 VP=abs(high -low[1]) VM=ABS(low-high[1]) VPS=average[p,t](VP) VMS=average[p,t](VM) VTR=TR(close) VTRS=Average[p,t](vtr) if VTRS <>0 then VORP=VPS/VTRS VORM=VMS/VTRS endif ///////////////////////////////////////////////////////////////////////////////// return e coloured by f as "digitale stochastic",0 AS "Zero",0.7 AS "Upper Zone",-0.7 AS "Lower Zone",VORP as "Vortex+",VORM as "Vortex-" |
Share this
No information on this site is investment advice or a solicitation to buy or sell any financial instrument. Past performance is not indicative of future results. Trading may expose you to risk of loss greater than your deposits and is only suitable for experienced investors who have sufficient financial means to bear such risk.
ProRealTime ITF files and other attachments :
Find other exclusive trading pro-tools on ![]()
PRC is also on YouTube, subscribe to our channel for exclusive content and tutorials
Hi Nicolás do yo know which are the better parameters for timeframe daily?
Or in weekly??
I don’t know, you should make your own studies.
Ok thanks Nico