

Damiani volameter
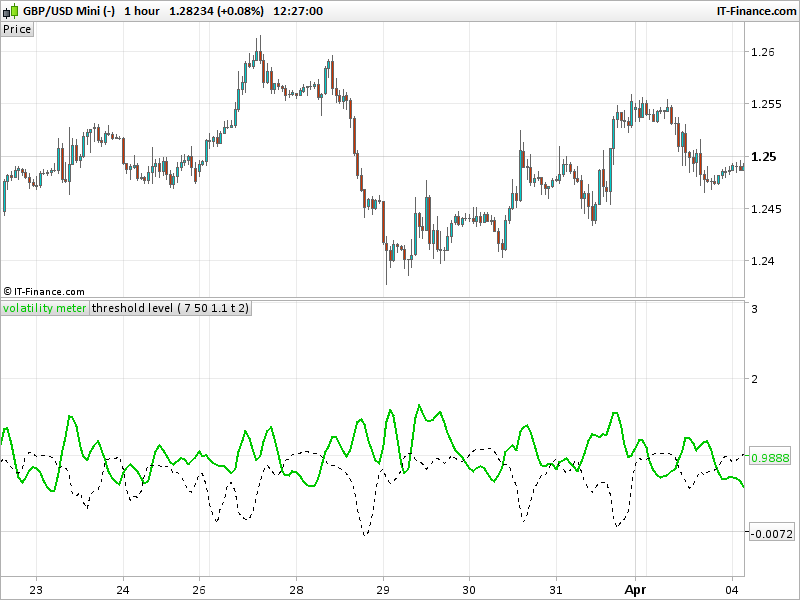
The Damiani Volameter is another trend and range filter. When the black line is above the green line, it shows that the market is ranging. When the green line is above the black line, the market is trending. The indicator does not display which direction the market is trending, thus, you might need to add another directional indicator like momentum, to make it a complete trading system.
How to use it? suggestion it just purely to filter the ranging market from the trending market. Like most range and trend filters, the challenge is to know when the range market is ending and when the new trend is starting, vice versa.
Trending market = use trend strategies (moving average cross, etc)
Range market = use range strategies (stochastics, oscillators)
(text description from the forum). Translated from Metatrader4 source code by request on english forum.
//PRC_Damiani Volatmeter | indicator
//24.04.2017
//Nicolas @ www.prorealcode.com
//Sharing ProRealTime knowledge
//translated from MT4 indicator code

//---settings
//Viscosity=7
//Sedimentation=50
//Thresholdlevel=1.1
//lagsupressor=1 //boolean value (default=true)
//MAtype=2 //MA type variable (2=Weighted average)
//---end of settings

if barindex>Sedimentation then
 lagsK=0.5
 sa = averagetruerange[Viscosity]
 s1 = indc[1]
 s3 = indc[3]
 if lagsupressor then
  vol=sa/averagetruerange[Sedimentation]+lagsK*(s1-s3)
 else
  vol=sa/averagetruerange[Sedimentation]
endif

 MA1=average[Viscosity,MAtype](typicalprice)
 D1=0
 Sum1=0
 for x1=0 to Viscosity-1 do
  D1=square(typicalprice[x1]-MA1)
  Sum1=Sum1+D1
  anti=sqrt(Sum1/(x1+1))
 next
 MA2=average[Sedimentation,MAtype](typicalprice)
 D2=0
 Sum2=0
 for x2=0 to Sedimentation-1 do
  D2=square(typicalprice[x2]-MA2)
  Sum2=Sum2+D2
  Sedi=sqrt(Sum2/(x2+1))
 next

 antithres=anti/Sedi

 t = Thresholdlevel
 t=t-antithres

 if(vol>t) then
  volt=vol
 else
  volt=vol
 endif

 indc=vol
endif

return volt coloured(0,200,0) style(line,2) as "volatility meter",t style(dottedline) as "threshold level"