Daily Weekly Monthly pivot points

Daily Weekly Monthly pivot points

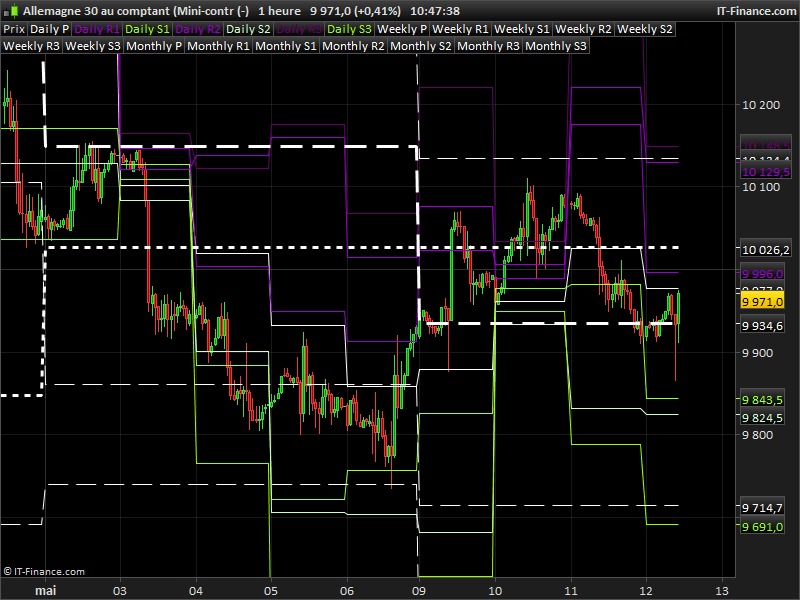
This indicator embed the daily, weekly and monthly pivot points with choice of their mode of calculation.

Each support and resistance of the daily, weekly and monthly pivot formulas are rendered on chart. Since pivot points indicator is a common request, I found this one to answer perfectly to a lot of them!

This code has been posted on forum by Henry, many thanks to him.


Share this

Risk disclosure:

No information on this site is investment advice or a solicitation to buy or sell any financial instrument. Past performance is not indicative of future results. Trading may expose you to risk of loss greater than your deposits and is only suitable for experienced investors who have sufficient financial means to bear such risk.

ProRealTime ITF files and other attachments : How to import ITF files into ProRealTime platform?

PRC is also on YouTube, subscribe to our channel for exclusive content and tutorials

  1. oyinloyea • 05/12/2016 #

    Good Morning. What type of Pivot is this. I notice it is not the Classic Pivot 

    • Nicolas • 05/12/2016 #

      Hello, you can change the pivot calculation mode by modifying the “mode” variable at line 2 from 0 to 3. This indicator embedded all kind of pivot calculation (classical, woodies, etc..)

  2. filiprb • 05/12/2016 #

    Hello Nicolas! I’m having trouble using the monthly pivot part of this indicator into a strategy.
    Here is an example of what I’m kind of trying to achieve;
    DEFPARAM CUMULATEORDERS = FALSE

    //

    Once lastMonthBarIndex = 0
    Once monthlyHigh = undefined
    Once monthlyLow = undefined
    Once monthlyPivot = undefined

    If Month<>Month[1] then
    monthlyHigh = Highest[BarIndex - lastMonthBarIndex](High)[1]
    monthlyLow = Lowest[BarIndex - lastMonthBarIndex](Low)[1]
    lastMonthBarIndex = BarIndex

    monthlyPivot = (close[1] + monthlyHigh + monthlyLow) / 3
    Endif

    MM1 = AVERAGE[7](CLOSE)

    //

    C1 = MM1 CROSSES OVER MONTHLYPIVOT

    IF NOT LONGONMARKET AND C1 THEN
    BUY 1 CONTRACTS AT MARKET

    SET STOP %LOSS 2
    SET TARGET %PROFIT 5
    ENDIF

    What I’m doing wrong here? Answer would be much appreciated.

  3. bbtrading • 05/12/2016 #

    Thanks for the code.May it be possible to have the lines plotted in my chart? At this moment I got it in my indicator field which is a mess and not easy reading.

    • Nicolas • 05/12/2016 #

      Use the wrench on the left upper side of the chart to apply an indicator on price.

    • Partha Banerjee • 05/12/2016 #

      Hello Nicolas,
      There is a small difference between the outcome of this weekly and monthly pivots (mode 0) with that of the standard ones as shown in the enclosed chart. The mismatch stays same whether I use Sunday bar or not. Is it possible to fix this.
      Regards,

  4. bbtrading • 05/12/2016 #

    Thank you so much!
     

  5. Beloul • 05/12/2016 #

    Bonjour,
    Suite à des backtest, j’essai actuellement de tester les pivots Week et mensuel. Après plusieurs essais avec le code ci-dessus mes pivots ne correspondent pas aux pivots PRT par défaut.

    Exemple :

    J’ai testé individuellement le code du pivot Week suivant :
    weeklyPivot = (weeklyHigh + weeklyLow + Close[1]) / 3
    weeklyHigh = Highest[BarIndex – lastWeekBarIndex](High)[1]
    weeklyLow = Lowest[BarIndex – lastWeekBarIndex](Low)[1]
    lastWeekBarIndex = BarIndex

    Mais le résultat ne me donne pas le bon pivot, avec la formule [(H+B+C)/3]

    Aurais je une erreur dans le code ?

  6. Beloul • 05/12/2016 #

    J’ai l’impression que le “lastweekbarindex” n’est pas reconnu convenablement,

  7. Takeshi • 05/12/2016 #

    Oui il y a de grosses différences entre ce code et les pivots Week/Mensuel malhereusement

  8. Partha Banerjee • 05/12/2016 #

    Hello Nicolas,
    I am unable to attach the image. How do I do it please to fix this issue.
    Regards,

  9. efex77 • 05/12/2016 #

    Hello,

    Is it possible to modify the code to calculate pivots based on quarters? I mean, calculate pivots every quarter of the year (not last 3 months). How can I do that?

  10. Jezza34 • 05/12/2016 #

    Hello
    J’essaie d’importer ce code sur PRT11.
    Mais malheureusement j’obtiens l’erreur “Un paramètre de type entier positif est attendu avec Highest”
    Une idée sur ce qui peux provoquer cette erreur ?
    Merci pour votre aide

  11. Toto8 • 05/12/2016 #

    Hello,
    When I use the code above with no change at all, I get an error message stating that an entire and positive number is expected with “Highest”.
    What’s wrong ?

  12. fabien philipp • 05/12/2016 #

    Hi,
    I have the same message error by importing the itf file, or by copying and pasting the code.

  13. Manu L. • 05/12/2016 #

    Idem

avatar
Register or

Likes

avatar avatar avatar avatar avatar avatar avatar avatar
Related users ' posts
Vonasi Thanks for the compliments. No this is not easily possible in v10.3 because it uses arrays w...
bruces Hi and thank you. I successfully imported original version above and added to my Prorealtim...
Musiar Hi Vonasi, The indicator is working like a charm on PRT v12; trying to adapt it for a strat...
JohnScher I've been looking for this for a long time! A very big thank you to you.
Nupsator hi, looks very interesting, i imported the indicator and inserted it into a 1h chart. Unfort...
Ciccarelli Franco Lo trovo interessante, ma non riesco a scaricarlo. Chi mi può aiutare?
Bard Excellent job Vonasi, thanks very much for updating and improving your previous indicator.
Gianluca sorry but doesnt work like you posted
Vonasi You would need to let me know the exact instrument and time frame that you are trying to app...
ipbvba idem ne fonctionne pas sur V11 (meme avec real time data), import OK mais aucune courbe dans...
Ciccarelli Franco I'm new to the Market, I imported the code, but I don't see anything, there is an empty box ...
tradermikey Is the available for v12?
Nicolas remplacer les valeurs de coloured(0,255,0) par coloured(r,g,b) et ajouter ces noms de variab...
mohamed merci Nicolas!
sacram14 Merci Nicolas pour ce set-up que je ne connaissais pas ! J'ai tenté de reprendre le code pou...
Vinks_o_7 Thanks Doc !
Maxime Baudin Intresting, thank you!
Nicolas Pour créer des alertes, vous pouvez suivre ce petit tutoriel : https://www.prorealtime.com/f...
thibault76 Bonjour Nicolas, cette stratégie est intéressante. Par contre, en 2022, le code ne fonction...
Nicolas Aucun message d'erreur pour ma part en version 11.1. Tu es certain de créer un code d'indica...
1Randy I would be interested an invite to your blog. I am still learning about the VSA and it looks...
repropel Buenos días TACBOLSA. Yo también estoy interesado en visitar tu blog. Podrías enviarme una i...
mobychix Hi, I just joined Pro Realtime and am very interested in VSA. I have read some books and did...
Stockastiss Can this code be simply transferred into Backtestingcode so one doesnt need to use call ? (i...
Vonasi Sorry for the late reply. Add the code to your strategy and remove line 5 and line 39. Chang...
viktorthunss Hi! How many averages are there? Can I see the somewhere?
carpentier Joffrey Bonjour à tous, Avant tout merci pour ce travail, cependant je suis bloqué quand je l'insta...
carpentier Joffrey Re, C'est ok, j'ai trouvé mon erreur... Cependant sur quel base peut on calculer son CALC...
Aragorna Hi Nicolas, How is it possible to use it in a higher timeframe plotted on a lower timeframe?...
Zigo Normaly it do work in version 11.
bertrandpinoy Hello to all, please does a coder can bring the indication of the price level on the chart o...
Zigo @bertrandpinoy add between line 50 and 51 : drawtext("#dnh#",barindex,low-2.618*AverageTrue...
leofi https://www.prorealcode.com/topic/simple-average-with-visual-color/
leofi Go visit www.prorealcode.com/topic/simple-average-with-visual-color/ and watch 2em post
Dritan Hi,I am new on Prorealtime and coding.I downloaded the indi but I have it on a separate wind...
stephane2.0
5 years ago
stephane2.0 c=exponentialaverage[9](MACDLine[12,26,9](close))
Forexcheckup Hi I down loaded the ITF file, it paints red for a down trend but for all up trends the can...
stephane2.0 line 22: r = 195 by r = 0 line 23: g = 195 by g = 0 line 24: b = 195 by b = 255 ;)
Zigo
5 years ago
fifi743 Good morning, there is no mistake about the shorts c11=SMI[14,3,5](close)>-40
Zigo has to be c11=SMI[14,3,5] < -40 (indeed)
xar3 Thank you ;-) Zigo
Suzu Yuk Regarding line68, //-- with indicator "properties", add coloured fill between euroOFF and...
manual_ice As far as I know, it is not possible to include "fill" inside an indicator. But, since ve...
Morrissey38 Muchísimas gracias Nicolás , muy amable.
Bruno Carnazzi extrèmement pertinent
Bruno Carnazzi Is that beatable ?
Maxime Baudin Very useful! Thanks Mat, and Happy New Year
nicko Great work. Thank you. However I am having trouble getting it to print in the first bar. If ...
Nicolas
5 years ago
Rex Oscillator
Rex Oscillator
2
Indicators
Rollerbob thank you Nicolas !
Guibourse Thanks ! Would it be possible to translate it into a screener ?
Nicolas
5 years ago
KDJ
KDJ
3
Indicators
fireleg79 Bonsoir Nicolas. Merci pour tout ton travail. Quand tu auras le temps pourras-tu jeter un oe...
Sejibi Bonsoir, En remplaçant percentJ = 3 * percentD - 2 * percentK par percentJ = 3 * perc...
JMARTY Bonjour, A la recherche d'un indicateur détectant les divergences sur DMI, je tombe sur ce...
Alps007 Hi Nicolas. Happy New Year. Can you please program me several MACD divergence screeners ...
Arlei Zanin Hello Nicolas, would it be possible to convert the Cloud to Pascal language? Thank you.
ashee i want it in MT4

Top