Daily candlestick on any timeframe chart

v10.3
Daily candlestick on any timeframe chart

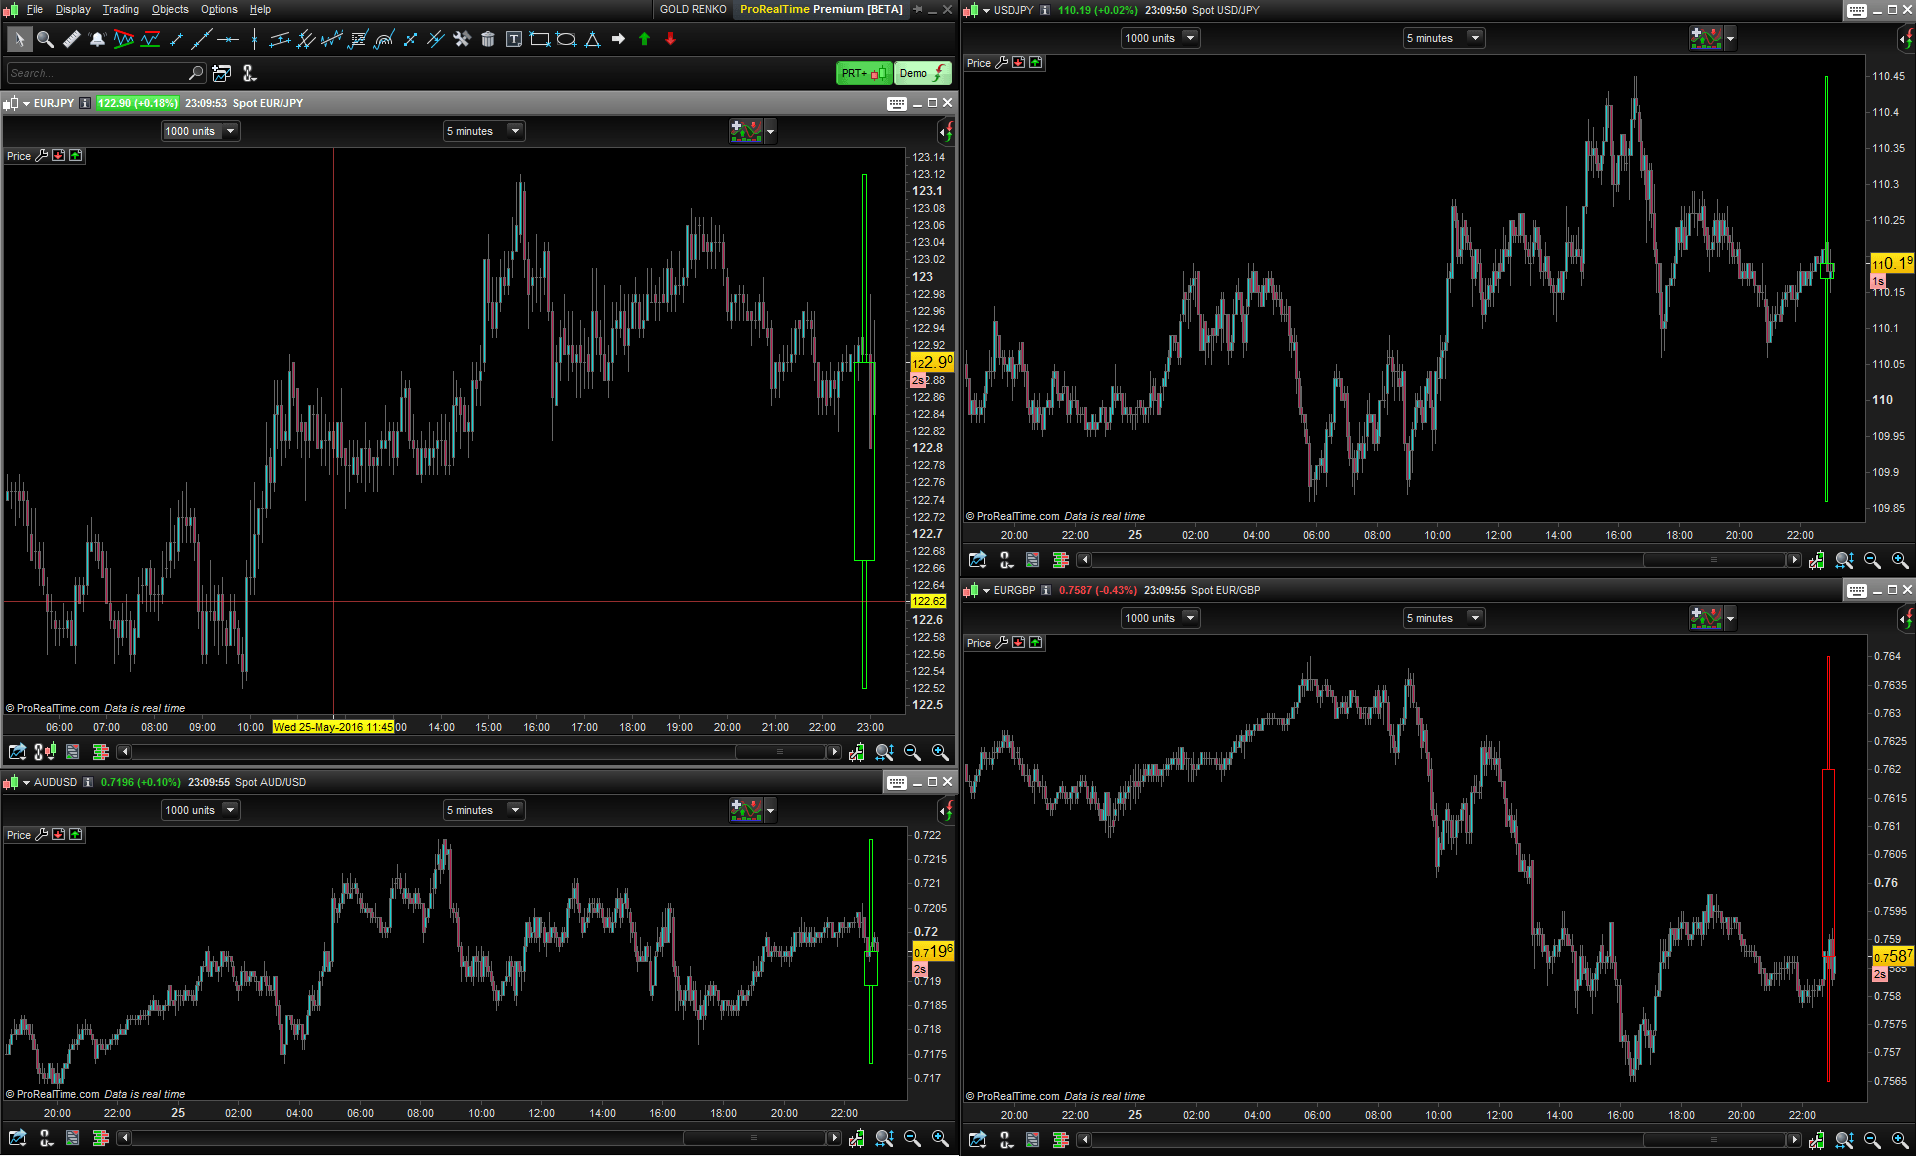
This indicator draw the actual daily candlestick on any timeframe. You can change the visibility of the candlestick with the “alpha” variable set from 0 to 255 which change the transparency of it. It is not possible to draw objects on the right of the chart, so the candle is displayed overlayed of the price.

The candlestick is made of rectangles drawn with the new graphical objects of the 10.3 version of the platform.

Share this

Risk disclosure:

No information on this site is investment advice or a solicitation to buy or sell any financial instrument. Past performance is not indicative of future results. Trading may expose you to risk of loss greater than your deposits and is only suitable for experienced investors who have sufficient financial means to bear such risk.

ProRealTime ITF files and other attachments : How to import ITF files into ProRealTime platform?

PRC is also on YouTube, subscribe to our channel for exclusive content and tutorials

  1. supertiti • 05/25/2016 #

    Bonjour Nicolas
    J’ai mis alpha en variable pour jouer sur la transparence car je ne vois pas comment on peut faire? pour autant la transparence ne bouge pas entre 0 et 255 ! j’ai loupé quelque chose ?
    merci
    bonne journée à tous
     

  2. supertiti • 05/25/2016 #

    désolé , j’ai compris ! alpha dans le code ou en variable !!

  3. Pere • 05/25/2016 #

    This is the code changed to draw the last 2 days:
    defparam drawonlastbaronly = true

    alpha = 255 //from 0 to 255 to change alpha transparency

    dop = dopen(0)
    dhi = dhigh(0)
    dlo = dlow(0)
    dcl = dclose(0)
    //Candle yesterday
    dopy = dopen(1)
    dhiy = dhigh(1)
    dloy = dlow(1)
    dcly = dclose(1)

    //candlestick color
    if dop>dcl then
    direction = -1
    else
    direction = 1
    endif

    if dopy>dcly then
    directiony = -1
    else
    directiony = 1
    endif

    //bullish candle
    if direction = 1 then
    //candlestick body
    DRAWRECTANGLE(barindex-7,dop,barindex-2,dcl) COLOURED(10,205,10,alpha)//Originalmente verde 10,255,10
    //candlestick high and low
    DRAWRECTANGLE(barindex-5,dcl,barindex-4,dhi) COLOURED(10,205,10,alpha)
    DRAWRECTANGLE(barindex-5,dop,barindex-4,dlo) COLOURED(10,205,10,alpha)
    endif

    //bearish candle
    if direction = -1 then
    //candlestick body
    DRAWRECTANGLE(barindex-7,dcl,barindex-2,dop) COLOURED(255,10,10,alpha)
    //candlestick high and low
    DRAWRECTANGLE(barindex-5,dop,barindex-4,dhi) COLOURED(255,10,10,alpha)
    DRAWRECTANGLE(barindex-5,dcl,barindex-4,dlo) COLOURED(255,10,10,alpha)
    endif
    //bullish candle yesterday
    if directiony = 1 then
    //candlestick body
    DRAWRECTANGLE(barindex-15,dopy,barindex-10,dcly) COLOURED(10,205,10,alpha)
    //candlestick high and low
    DRAWRECTANGLE(barindex-13,dcly,barindex-12,dhiy) COLOURED(10,205,10,alpha)
    DRAWRECTANGLE(barindex-13,dopy,barindex-12,dloy) COLOURED(10,205,10,alpha)
    endif

    //bearish candle yesterday
    if directiony = -1 then
    //candlestick body
    DRAWRECTANGLE(barindex-15,dcly,barindex-10,dopy) COLOURED(255,10,10,alpha)
    //candlestick high and low
    DRAWRECTANGLE(barindex-13,dopy,barindex-12,dhiy) COLOURED(255,10,10,alpha)
    DRAWRECTANGLE(barindex-13,dcly,barindex-12,dloy) COLOURED(255,10,10,alpha)
    endif

    RETURN

  4. M.Nicolas 81 • 05/25/2016 #

    Hola Nicolas.
    ¿Existe la posibilidad de que este indicador se muestre también en el histórico anterior ?

    • Nicolas • 05/25/2016 #

      That would be possible to be coded using MTF indicator in PRT v11.

avatar
Register or

Likes

avatar avatar avatar avatar avatar avatar avatar avatar avatar avatar avatar avatar avatar avatar avatar avatar

+2 more likes

Related users ' posts
adeelq79 Great work Ivan. Thanks
Quino Another really interesting indicator. It works very well on periods below 25. Just a few cos...
supertiti hola Ivan Eso quiere decir que el Parabolic sar RSI est igual al parabolic sar de PRT ? p...
supertiti buenas tardes Ivan me gusteria tener lo mismo on chart con los puntos azules y rosas de c...
LucasBest Thanks for the translation. This one can be compared to dynamic zone RSI
Iván
1 month ago
Iván Sorry... There is a mistake in line 76. Should be if openday[i]openday[i+1] then
DLVx You do not specify how to read the Calmar ratio. Above 1 is OK and 0 is neutral? Can you she...
lee HI thank you for this indicator. Is it possible to create a screener based on this for when ...
xpe74 Hello it seems the file format does not allow to import the file. At importation stage, an e...
Iván You always can copy/paste directly from the post
roccafragius Thank you so much, for my point of view very useful!!!
NicoGB67 Excelente trabajo!!
Jrmjrm Bonsoir est-il possible d'avoir cet indicateur, mais à la place du Wilder Average, utiliser ...
geroniman merci Ivan, super indicatuer. Les cours vont souvent toucher 50% des zones vertes ou rouges....
Iván Pour ajouter une ligne supplémentaire, il suffit de créer une nouvelle variable, par exemple...
Maurizio A. excellent indicateur ! comment puis-je modifier le code pour afficher uniquement les dernier...
Iván Hi! just change line13 for this: showsignals=1
Quino Hi Excellent indicator as usual. Just 2 questions: Why LenH and LenL = 15 as Len could be...
Iván Hi! good question. This is a code request traslation from other platform. I took same inputs...

Top